Download
1 / 28
290 likes | 471 Vues
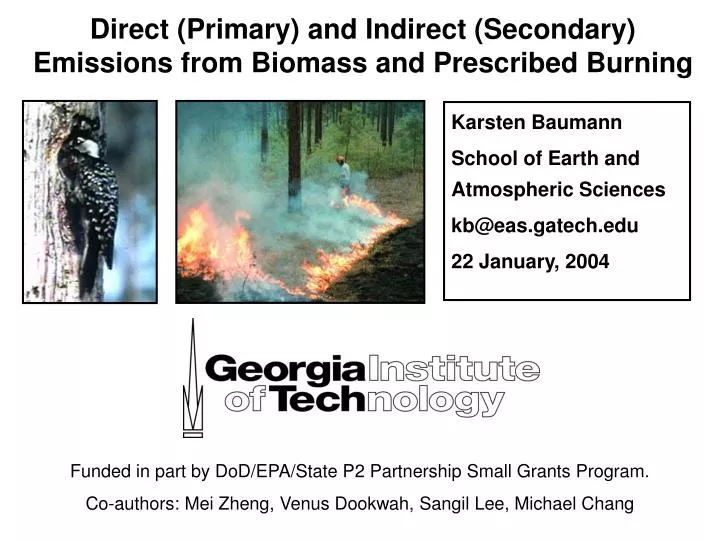
Direct (Primary) and Indirect (Secondary) Emissions from Biomass and Prescribed Burning. Karsten Baumann School of Earth and Atmospheric Sciences kb@eas.gatech.edu 22 January, 2004. Funded in part by DoD/EPA/State P2 Partnership Small Grants Program.

E N D
Direct (Primary) and Indirect (Secondary) Emissions from Biomass and Prescribed Burning Karsten Baumann School of Earth and Atmospheric Sciences kb@eas.gatech.edu 22 January, 2004 Funded in part by DoD/EPA/State P2 Partnership Small Grants Program. Co-authors: Mei Zheng, Venus Dookwah, Sangil Lee, Michael Chang
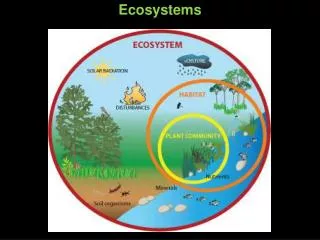
Manage 94,000 acr, Burn 1/3 per yr, ~ 520 acr/day Endangered Species Act Clean Air Act PM2.5 Eceedance at Columbus-OLC near Fort Benning for SE winds in Winter 2001/02 Problem: ESA versus CAA Military Installations in SE-US occupy habitat of endangered species (red-cockaded woodpecker), and are required to maintain ecosystem by prescribed burning, risking violations of the NAAQS.
Prescribed Burn Study: Objectives and Outlook • In this initial pilot study, establish understanding of the direct and indirect impact of current burn practices on sub-regional Air Quality. • Lay foundation for more comprehensive and better focused Phase II Study to optimize burn practices toward minimum AQ impact. • Create results of general applicability for the benefit of LMBs on other military installations in the SE-US and beyond. • Learn lessons that help create and implement new revised land management strategies for the benefit of other agencies and institutions that face often times devastating wild fires in other parts of the Nation.
Issues on Local to Global Scales Do prescribed burns reduce the risk of wild fires? In the continental U.S. prescribed burns and forest fires contribute ~37 % to the total direct fine PM emissions of ~1 Mio t per year* * Nizich et al., EPA Report 454/R-00-002 (NTIS PB2000-108054), RTP, NC, 2000 • Effects on • Health • Visibility • Air Quality • Climate
To what extent does prescribed burning impact local and regional air quality? O3, SOA CO CO2 VOCs NOx PM Toxics
Direct Emissions 1. Savannah Grass Lobert et al, Nature 346, 552-554, 1990. Crutzen and Andreae, Science 250, 1669-78, 1990. FlamingSmoldering CO2CO NOxNitriles SO2(HCN, CH3CN) N2OCH4, NMHC CO/NOx ~ 25, SO2/NOx ~ 0.1 2. Wood/Coal Briquets Struschka et al, IVD-RdL Univ Stuttgart, Rep.34, 1995 FlamingSmoldering CO/NOx SO2/NOxCO/NOx SO2/NOx Wood 18 +-9 0.2 +-0.148 +-17 0.3 +-0.3 Coal 9 +-5 23 +-650 +-40 18 +-12
Influence on Remote Locations Canadian Forest Fires Impacting SE-US in Summer 1995 Wotawa and Trainer, Science 288, 324-328, 2000. Open symbols: period 6/30 – 7/4. Increased regional CO background level! Is typically 80-90 ppbv. Influence on urban areas: - less on slope (mobile src) - more on intercept ! Shorter lifetime of NOy: some species (eg HNO3) lost due to surface deposition during transport in PBL.
Regional CO vs Burn Activity in GA during PBS Monthly average CO background level derived from CO/NOy regressions at OLC (left) in comparison with prescribed burn areas at Forts Benning and Gordon, their surrounding counties, and the rest of Georgia (only 10% of true area plotted!).
Direct Emissions of VOCs Mixing ratios enhanced above local background at Fort Gordon TA21. Fuel: 230 acres of 2 year rough of pine needles, leaves, and woody debris.
VOC Emission Estimates - Comparison with Mobile Sources Average emissions per burn (~500 acr) compare with daily mobile emissions ! 3,4-E.toluene higher during smoldering, 2-E.toluene highest for gasoline fueled vehicles Contribution to P(SOA) potential is highest for Toluene from flaming and Xylenes from smoldering, minimal for 2-E.toluene.
15 14 Carbonyls Cyclic compounds 13 Branched Alkanes 12 n-Alkynes 11 Aromatics n-Alkanes 10 n-Alkenes 9 8 Mass Emission Rate (g/kg of biomass burned) 7 6 5 4 3 2 1 0 FPSP WGLP MHFF Pinus taeda Pinus ponderosa Tsuga heterophylla Direct (Primary) PM Emissions from Foliar Fuel Combustion in Lab Hays, Geron et al., ES&T 36, 2281-2295, 2002 Biomass Litter Composites MHFF… mixed hardwood (oak) forest foliage FPSP… Florida palmetto & slash pine WGLP… wiregrass & longleaf pine
POC High-Vol Sampling and GC/MS Analyses Quantification of >100 Particle-phase Organic Compounds Retene Pimaric acid Abietic acid Sandaracopimaric acid Levoglucosan Five consecutive 5-h samples taken at OLC between February 5th 1200 and 6th 1300
Nighttime avg 53% wood ? Influence from February 5th Burn: Source Apportionment Low P front moving through GA on 3rd and 4th, with cold dry air moving in behind it from NE, causing below normal T under clear skies. Prescribed burning of 937 acres on 2/5 1200 at ~28 km to east, smoldering until 2/6 am.
? O3, SOA CO CO2 VOCs NOx PM Toxics
Secondary organic aerosol (SOA): Organic compounds, some highly oxygenated, residing in the aerosol phase as a function of atmospheric reactions that occur in either gas or particle phases. SOA formation mainly depends on: Emissions & forming potential of precursors aromatics (BTX, aldehydes, carbonyls) terpenes (mono-, sesqui-) other biogenics (aldehydes, alcohols) Presence of other initiating reactants O3, OH, NO3, sunlight, acid catalysts Mechanisms (with half hr to few hr yields): Gas-to-particle conversion/partitioning e.g. terpene oxidation Heterogeneous reactions aldehydes via hydration and polymerization, forming hemiacetal/acetal in presence of alcohols Particle-phase reactions acetal formation catalytically accelerated by particle sulfuric acid (Jang and Kamens, ES&T, 2001)
Photochemical Processes Leading to O3 and PM An Assessment of Tropospheric Ozone Pollution, A North American Perspective, NARSTO, National Acad. Press, 2000. NOz SOA
January May 2003 3770 acres 4006 acres 504 251 1256 acres 937 acres No-Burn Background PM2.5 Mass & CompositionIndividual Burn Events and Acres Burned Burning early in the season seems advantageous
January May 2003 PM2.5 Mass & CompositionOM/OC & [O3-max] Averages per Burn Event Higher PM mass and OM/OC with higher [O3] later in the season
PM2.5 Wind Roses: Seasonal Differences Across GAIndications for Regional Transport? Period 2001+ 02 MAY-OCT NOV-APR
…Similarity to Daytime O3 Period 2001+ 02 MAY-OCT NOV-APR
Findings • Progressively increasing fine PM mass and organics fraction correlate with increased temperature, solar radiation, and O3, indicating increased oxidizing potential, hence increased potential for SOA formation. • Strongest direct impact from prescribed burning emissions at OLC site encountered at night under clear skies nocturnal inversion and slow moving easterly component flow (along the Upatoi Creek); the contribution from the PB source indicators is then ~52 % to total OC. • VOCs with low Ps (C>6), esp. toluene and xylenes are being emitted at similar quantities per average burn day than the daily emissions of the mobile sources of the respective county, Muscogee (Fort Benning) and Richmond (Fort Gordon); the P(SAO) potential is highest for toluen followed by xylenes. • The regional CO background is closely correlated with open burning activities in Georgia, suggesting i) substantially longer smoldering phases than originally assumed, ii) similar source behavior across the entire SE-US??
Summer Winter PM2.5 Sources Near Columbus Driving Nighttime Averages in Winter 2001/02 Seasonal Differences in Diurnal Cycles: O3 & PM2.5
45’ x 40’ Fence 4’ 11’ 33’ x 7’ level Platform ~ 1’ above ground Guy wired 8m Tower tilt down 10’ x 12’ Shelter a/c 4 additional 20 A circuit breakers 4’ 14’ 3’ Stair step 4 quadruple outlets on individual breakers 8’ 10’ Gate N OLC site upgrade Research site at Oxbow Meadows Environmental Learning Center upgraded for PM source apportionment and in situ gas phase sampling
Particle Composition Monitor “PCM” Channel 1: NH3 Na+, K+, NH4+, Ca+2 Channel 2: HF, HCl, HONO, HNO3, SO2, HCOOH, CH3COOH, (COOH)2 F-, Cl-, NO3-, SO4=, HCOO-, CH3COO-, C2O4= Channel 3: EC, OC, WSOC, “SVOC” Additional higher resolutionCO, NO, NOy, O3,PM-mass, and basic meteorology
VOC Canister Sampling and GC/FID Detection of Volatile Organic Compounds Quantification of >60 compounds, incl. CO2 for “fire” samples Collaborating with Prof. Don Blake, UC Irvine, CA 92697 http://fsr10.ps.uci.edu/GROUP/group.html C2-C6 n-alkanes, alkenes, branched alkenes, alkynes isoprene Cyclic compounds monoterpenes (a-, b-pinene) Aromatics, organic nitrates, halogenated species methylchloride
Diesel Exhaust 20% Gasoline Exhaust 3% Other Organic Carbon {SOA} 30% Vegetative Detritus 2% Meat Cooking 6% Wood Combustion 39% Source Contributions to Organic Carbon (OC) in Ambient PM2.5 Pensacola, FL October 1999 Measured average [PM2.5] = 16.6 mg m-3 [OC] = 4.6 mg m-3 Zheng et al., ES&T 2002