Download
1 / 162
1.62k likes | 1.79k Vues
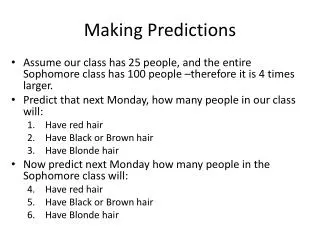
Warm Up Solve 2 x – 3 y = 12 for y. The ratio of red hair to brown hair in a class is 2:7. If one student is randomly chosen, what is the probability that the student has red hair?

E N D
Warm Up • Solve2x –3y = 12 for y. • The ratio of red hair to brown hair in a class is • 2:7. If one student is randomly chosen, what is the probability that the student has red hair? • 4.Suppose a letter of the alphabet is randomly chosen. What is the probability that it will be a letter that is found in the word Tennessee? 2. Graph forD:{–10, –5, 0, 5, 10}.
Objectives Identify linear functions and linear equations. Graph linear functions that represent real-world situations and give their domain and range.
The graph represents a function because each domain value (x-value) is paired with exactly one range value (y-value). Notice that the graph is a straight line. A function whose graph forms a straight line is called a linear function.
Example 1A: Identifying a Linear Function by Its Graph Identify whether the graph represents a function. Explain. If the graph does represent a function, is the function linear? Each domain value is paired with exactly one range value. The graph forms a line. linear function
Example 1B: Identifying a Linear Function by Its Graph Identify whether the graph represents a function. Explain. If the graph does represent a function, is the function linear? Each domain value is paired with exactly one range value. The graph is not a line. not a linear function
Example 1C: Identifying a Linear Function by Its Graph Identify whether the graph represents a function. Explain. If the graph does represent a function, is the function linear? The only domain value, –2, is paired with many different range values. not a function
Check It Out! Example 1b Identify whether the graph represents a function. Explain. If the graph does represent a function, is the function linear? Each domain value is paired with exactly one range value. The graph forms a line. linear function
Check It Out! Example 1c Identify whether the graph represents a function. Explain. If the graph does represent a function, is the function linear? Each domain value is not paired with exactly one range value. not a function
You can sometimes identify a linear function by looking a table or a list of ordered pairs. In a linear function, a constant change in x corresponds to a constant change in y.
The points from this table lie on a line. In this table, a constant change of +1 in x corresponds to constant change of –3 in y. These points satisfy a linear function.
The points from this table do not lie on a line. In this table, a constant change of +1 in x does not correspond to a constant change in y. These points do not satisfy a linear function.
x y +4 +4 +4 +4 +3 +3 +3 +3 Example 2A: Identifying a Linear Function by Using Ordered Pairs Tell whether the set of ordered pairs satisfies a linear function. Explain. {(0, –3), (4, 0), (8, 3), (12, 6), (16, 9)} Write the ordered pairs in a table. Look for a pattern. 0 4 8 12 16 –3 0 3 6 9 A constant change of +4 in x corresponds to a constant change of +3 in y. These points satisfy a linear function.
x y +2 +2 +2 +2 –12 –4 +4 +12 Example 2B: Identifying a Linear Function by Using Ordered Pairs Tell whether the set of ordered pairs satisfies a linear function. Explain. {(–4, 13), (–2, 1), (0, –3), (2, 1), (4, 13)} Write the ordered pairs in a table. Look for a pattern. –4 –2 0 2 4 13 1 –3 1 13 A constant change of 2 in x corresponds to different changes in y. These points do not satisfy a linear function.
Another way to determine whether a function is linear is to look at its equation. A function is linear if it is described by a linear equation. A linear equation is any equation that can be written in the standard form shown below.
Notice that when a linear equation is written in standard form • x and y both have exponents of 1. • x and y are not multiplied together. • x and y do not appear in denominators, • exponents, or radical signs.
For any two points, there is exactly one line that contains them both. This means you need only two ordered pairs to graph a line.
x = 2y + 4 –2y –2y x –2y = 4 Example 3A: Graphing Linear Functions Tell whether the function is linear. If so, graph the function. x = 2y + 4 Write the equation in standard form. Try to get both variables on the same side. Subtract 2y from both sides. The equation is in standard form (A = 1, B = –2, C = 4). The equation can be written in standard form, so the function is linear.
• • • Example 3A Continued x = 2y + 4 Plot the points and connect them with a straight line. To graph, choose three values of y, and use them to generate ordered pairs. (You only need two, but graphing three points is a good check.)
Example 3B: Graphing Linear Functions Tell whether the function is linear. If so, graph the function. xy = 4 This is not linear, because x and y are multiplied. It is not in standard form.
y = 5x – 9 –5x –5x –5x + y = – 9 Check It Out! Example 3a Tell whether the function is linear. If so, graph the function. y = 5x – 9 Write the equation in standard form. Try to get both variables on the same side. Subtract 5x from both sides. The equation is in standard form (A = –5, B = 1, C = –9). The equation can be written in standard form, so the function is linear.
• • • Check It Out! Example 3a Continued y = 5x – 9 To graph, choose three values of x, and use them to generate ordered pairs. (You only need two, but graphing three points is a good check.) Plot the points and connect them with a straight line.
Check It Out! Example 3b Tell whether the function is linear. If so, graph the function. y = 12 The equation is in standard form (A = 0, B = 1, C = 12). The equation can be written in standard form, so the function is linear.
y Check It Out! Example 3b Continued y = 12
Check It Out! Example 3c Tell whether the function is linear. If so, graph the function. y = 2x This is not linear, because x is an exponent.
For linear functions whose graphs are not horizontal, the domain and range are all real numbers. However, in many real-world situations, the domain and range must be restricted. For example, some quantities cannot be negative, such as time.
Sometimes domain and range are restricted even further to a set of points. For example, a quantity such as number of people can only be whole numbers. When this happens, the graph is not actually connected because every point on the line is not a solution. However, you may see these graphs shown connected to indicate that the linear pattern, or trend, continues.
Check It Out! Example 4 What if…? At a salon, Sue can rent a station for $10.00 per day plus $3.00 per manicure. The amount she would pay each day is given by f(x) = 3x + 10, where x is the number of manicures. Graph this function and give its domain and range.
f(x) = 3x + 10 x 0 f(0) = 3(0) + 10 = 10 1 f(1) = 3(1) + 10 = 13 2 f(2) = 3(2) + 10 = 16 f(3) = 3(3) + 10 = 19 3 4 f(4) = 3(4) + 10 = 22 f(5) = 3(5) + 10 = 25 5 Check It Out! Example 4 Continued Choose several values of x and make a table of ordered pairs. The number of manicures must be a whole number, so the domain is {0, 1, 2, 3, …}. The range is {10.00, 13.00, 16.00, 19.00, …}.
The individual points are solutions in this situation. The line shows that the trend continues. Check It Out! Example 4 Continued Graph the ordered pairs.
Warm-Up Tell whether each set of ordered pairs satisfies a linear function. Explain. 1. {(–3, 10), (–1, 9), (1, 7), (3, 4), (5, 0)} 2. {(3, 4), (5, 7), (7, 10), (9, 13), (11, 16)} Tell whether each function is linear. If so, graph the function. 3. y = 3 – 2x 4. 3y = 12 5. The cost of a can of iced-tea mix at Save More Grocery is $4.75. The function f(x) = 4.75x gives the cost of x cans of iced-tea mix. Graph this function and give its domain and range.
Objectives Find x- and y-intercepts and interpret their meanings in real-world situations. Use x- and y-intercepts to graph lines.
The y-interceptis the y-coordinate of the point where the graph intersects the y-axis. The x-coordinate of this point is always 0. The x-interceptis the x-coordinate of the point where the graph intersects the x-axis. The y-coordinate of this point is always 0.
Example 1A: Finding Intercepts Find the x- and y-intercepts. The graph intersects the y-axis at (0, 1). The y-intercept is 1. The graph intersects the x-axis at (–2, 0). The x-intercept is –2.
5x – 2y = 10 5x – 2y = 10 5x – 2(0) = 10 5(0) – 2y = 10 5x – 0 = 10 0 – 2y = 10 – 2y = 10 5x = 10 x = 2 y = –5 The y-intercept is –5. The x-intercept is 2. Example 1B: Finding Intercepts Find the x- and y-intercepts. 5x – 2y = 10 To find the x-intercept, replace y with 0 and solve for x. To find the y-intercept, replace x with 0 and solve for y.
x 5 10 20 0 25 f(x) = 200 – 8x 160 120 40 0 200 Example 2: Sports Application Trish can run the 200 m dash in 25 s. The function f(x) = 200 – 8x gives the distance remaining to be run after x seconds. Graph this function and find the intercepts. What does each intercept represent? Neither time nor distance can be negative, so choose several nonnegative values for x. Use the function to generate ordered pairs.
Example 2 Continued Graph the ordered pairs. Connect the points with a line. y-intercept: 200. This is the number of meters Trish has to run at the start of the race. x-intercept: 25. This is the time it takes Trish to finish the race, or when the distance remaining is 0.
Check It Out! Example 2a The school sells pens for $2.00 and notebooks for $3.00. The equation 2x + 3y = 60 describes the number of pens x and notebooks y that you can buy for $60. Graph the function and find its intercepts. Neither pens nor notebooks can be negative, so choose several nonnegative values for x. Use the function to generate ordered pairs.
Check It Out! Example 2a Continued The school sells pens for $2.00 and notebooks for $3.00. The equation 2x + 3y = 60 describes the number of pens x and notebooks y that you can buy for $60. Graph the function and find its intercepts. x-intercept: 30; y-intercept: 20
Check It Out! Example 2b The school sells pens for $2.00 and notebooks for $3.00. The equation 2x + 3y = 60 describes the number of pens x and notebooks y that you can buy for $60. What does each intercept represent? x-intercept: 30. This is the number of pens that can be purchased if no notebooks are purchased. y-intercept: 20. This is the number of notebooks that can be purchased if no pens are purchased.
Helpful Hint You can use a third point to check your line. Either choose a point from your graph and check it in the equation, or use the equation to generate a point and check that it is on your graph. Remember, to graph a linear function, you need to plot only two ordered pairs. It is often simplest to find the ordered pairs that contain the intercepts.
3x – 7y = 21 3x – 7y = 21 3x – 7(0) = 21 3(0) – 7y = 21 x = 7 Example 3A: Graphing Linear Equations by Using Intercepts Use intercepts to graph the line described by the equation. 3x – 7y = 21 Step 1 Find the intercepts. y-intercept: x-intercept: 3x = 21 –7y = 21 y = –3
x Example 3A Continued Use intercepts to graph the line described by the equation. 3x – 7y = 21 Step 2 Graph the line. Plot (7, 0) and (0, –3). Connect with a straight line.
Check It Out! Example 3b Use intercepts to graph the line described by the equation. Step 1 Write the equation in standard form. Multiply both sides 3, to clear the fraction. 3y = x –6 Write the equation in standard form. –x + 3y = –6
Check It Out! Example 3b Continued Use intercepts to graph the line described by the equation. –x + 3y = –6 Step 2 Find the intercepts. y-intercept: x-intercept: –x + 3y = –6 –x + 3y = –6 –(0) + 3y = –6 –x + 3(0) = –6 3y = –6 –x = –6 x = 6 y = –2
Check It Out! Example 3b Continued Use intercepts to graph the line described by the equation. –x + 3y = –6 Step 3 Graph the line. Plot (6, 0) and (0, –2). Connect with a straight line.
Warm-Up 1. An amateur filmmaker has $6000 to make a film that costs $75/h to produce. The function f(x) = 6000 – 75x gives the amount of money left to make the film after x hours of production. Graph this function and find the intercepts. What does each intercept represent? 2. Use intercepts to graph the line described by
Objectives Find rates of change and slopes. Relate a constant rate of change to the slope of a line.
A rate of change is a ratio that compares the amount of change in a dependent variable to the amount of change in an independent variable.
Example 1: Application The table shows the average temperature (°F) for five months in a certain city. Find the rate of change for each time period. During which time period did the temperature increase at the fastest rate? Step 1 Identify the dependent and independent variables. dependent: temperatureindependent: month