Download
1 / 45
450 likes | 572 Vues
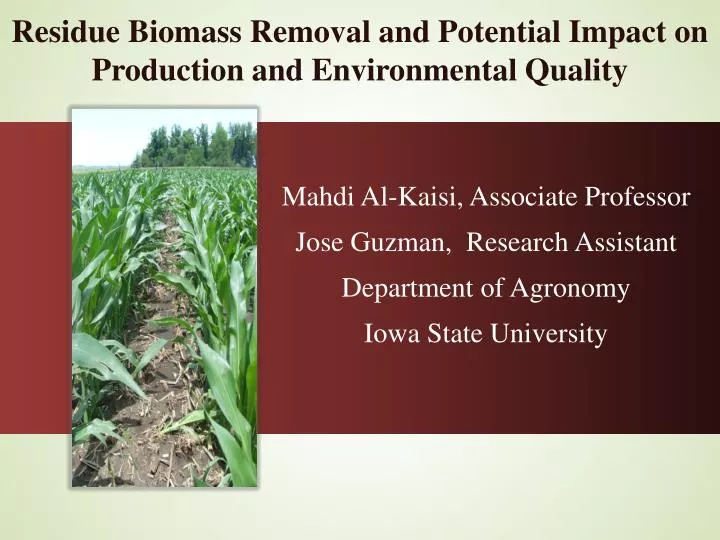
Residue Biomass Removal and Potential Impact on Production and Environmental Quality . Mahdi Al- Kaisi , Associate Professor Jose Guzman, Research Assistant Department of Agronomy Iowa State University. Outline. Background Project Overview Preliminary Results Summary and Conclusions.

E N D
Residue Biomass Removal and Potential Impact on Production and Environmental Quality Mahdi Al-Kaisi, Associate Professor Jose Guzman, Research Assistant Department of Agronomy Iowa State University
Outline Background Project Overview Preliminary Results Summary and Conclusions BackgroundProject Overview GHG results Soil Carbon results Summary & Conclusions
Interest in Corn Residue for Bioethanol 90 *RFA, http://www.ethanolrfa.org/industry/statistics/#C Gap for cellulosic ethanol to fill October 2007 and 2009 capacity*(6.9 and 10.7 billion gal) 75 60 45 Goal (billion gal ethanol) **NCGA, http://www.ncga.com/ethanol/pdfs/2007/ 30 Ethanol from corn grain** 15 0 2015 2025 2005 2035 • Replace approximately 30% of gasoline with bioethanol by 2030 BackgroundProject Overview GHG results Soil Carbon results Summary & Conclusions
Interest in Corn Residue for Bioethanol • Currently available biomass from cropland is 194 million dry tons year-1 – estimated to increase to 425 – 600 million ton* • Approximately 144 million tons from corn – estimated to increase to 170 – 256 million ton* *billion-ton annual supply. 2005 *billion-ton annual supply. 2005 BackgroundProject Overview GHG results Soil Carbon results Summary & Conclusions
Value of Corn Residue • Environmental services • Reduce soil erosion • Enhance soil carbon • Protect water quality • Source of Nutrients • Wild life habitat • Renewable energy feedstock • 428 million ton from crop residues* BackgroundProject Overview GHG results Soil Carbon results Summary & Conclusions
Corn Residue Removal Concerns Research Findings: • Decline of soil C source • Decline of soil quality • Removal of soil nutrients source • Acceleration of soil erosion risk • Long-term potential reduction of productivity BackgroundProject Overview GHG results Soil Carbon results Summary & Conclusions
Benefits of Soil Organic Carbon • Physical Effects: Soil aggregation, bulk density, erosion, drainage • Chemical Effects:Cation exchange capacity, metal complexing, buffering capacity, supply and availability of N, P, S, and micronutrients • Biological Effects: promotes bacteria, fungi, actinomycetes, earthworms, roots, and other microorganisms. BackgroundProject Overview GHG results Soil Carbon results Summary & Conclusions
Research Question • What are the appropriate level(s) of residue removal and management practices needed to sustain productivity and protect soil quality? BackgroundProject Overview GHG results Soil Carbon results Summary & Conclusions
Goal & Objectives Goal of this project is to establish coordinated field studies to determine residue removal effect on the following Grain Yield Nutrient cycling, and crop biomass production Soil C and N sequestration potential with different residue management practices 3) Estimation of GHG emissions from soil 4) Impacts on soil quality indices BackgroundProject Overview GHG results Soil Carbon results Summary & Conclusions
Background and Study Description • Sites History: • Two Research sites: Agronomy and Armstrong Research Farms • Previous Tillage and Crop Rotation: Chisel Plow and Corn/Soybean • Fertilizer Program: Approximately 130lb N/acre and removal rate for P&K. • Baseline O.M. in 2008:
Background and Study Description • Experiment Layout and Treatments: • Split-split plot design: • Main Treatment: tillage (chisel till, no-till) • Split Treatment: residue removal level of (0, 50, and 100%) • Split-Split Treatment: 6 N fertilization rates • (0, 50, 100, 150, 200, and 250 lb N acre-1) • Side-dressed UAN in the spring • Number of Replications: Three
Tillage and Residue Removal Corn Residue Removal Tillage and Residue Removal NT – 0% 0% CP – 0% 50% CP – 100% 100% BackgroundProject Overview GHG results Soil Carbon results Summary & Conclusions
Measurements and Data Collection • Study treatments established on two sites in the fall of 2008 • Baseline data in fall 2008 and field monitoring in 2009, 2010, and 2011 included: • Soil C, GHG emission, soil bulk density, • Residue decomposition, nutrients cycling, and lab studies • Crop grain and biomass • Root biomass and microbial biomass carbon • Soil compaction and infiltration • Aggregate Stability and SOC for different size fractions
Grain Production: 2009 BackgroundProject Overview Grain Soil Quality Summary & Conclusions
Grain Production: 2010 BackgroundProject Overview Grain Soil Quality Summary & Conclusions
Corn Yield as affected by tillage and and N rate in 2009
Corn Yield as affected by tillage and and N rate in 2010
Grain Production: 2010 BackgroundProject Overview Grain Soil Quality Summary & Conclusions
Effect of N fertilizer Rate on Corn Biomass N and C Content at Plant Maturity Across Sites, 2009-2010 (John Sawyer and Jose Pantoja)
Effect of N Fertilizer Rate on Corn Biomass C: N Ratio at Plant Maturity Across Sites, 2009-2010 (John Sawyer and Jose Pantoja)
Greenhouse Gas Emissions under different Residue Managements • CO2 and N2O soil surface emissions • Weekly soil surface CO2 readings coupled with soil moisture and temperature • CO2 • LI-COR • N2O • GRACEnet Chamber-based Trace Gas Flux Measurement Protocol (GC analyzer) (LI-COR 6400) Chamber-based Trace Gas Flux Measurement BackgroundProject Overview GHG results Soil Carbon results Summary & Conclusions
Seasonal Soil Surface CO2 Emissions BackgroundProject Overview GHG results Soil Carbon results Summary & Conclusions
Soil Surface CO2Emission: Tillage BackgroundProject Overview GHG results Soil Carbon results Summary & Conclusions
Potential Sink or Source for Atmospheric CO2-C • Include above ground biomass, grain, and root biomass for ANPP • (ANPP + BNPP) – Rh • Positive values indicate a sink for atmospheric CO2 BackgroundProject Overview GHG results Soil Carbon results Summary & Conclusions
Seasonal N2O Emission: Tillage Effect Two wet years, especially 2010 BackgroundProject Overview GHG results Soil Carbon results Summary & Conclusions
N2O Emission: Nitrogen Fertilization Effect • N2O emission increased with increased soil water and fertilizer N rates • Losses of N kg ha-1 range from 4 to 6 % of N applied BackgroundProject Overview GHG results Soil Carbon results Summary & Conclusions
N2O Emission: Residue Removal Effect • In general, higher N2O emissions when no residue was removed • Higher water content when residue is left on the surface BackgroundProject Overview GHG results Soil Carbon results Summary & Conclusions
Soil Quality No-till with 0 % residue removed No-till with 100 % residue removed BackgroundProject Overview Grain Soil Quality Summary & Conclusions
Soil C Sequestration Potential under different Residue Managements • Soil samples are being collected every August • TC/TN • Microbial Biomass-C • Bulk Density • pH • 5 depths • 0-3, 3-6, 6-12, 12-18, 18-24 in • Carbon Budget • NEP = (ANPP + BNPP) – Rh • NEP=Net ecosystem productivity, Rh=microbialrespiration Soil sampling in no-till BackgroundProject Overview GHG results Soil Carbon results Summary & Conclusions
Potential Soil Organic Carbon Sequestration Include aboveground and root biomass contribution to soil C Positive values indicate net gain in SOC BackgroundProject Overview GHG results Soil Carbon results Summary & Conclusions
Soil Organic Carbon BackgroundProject Overview Grain Soil Quality Summary & Conclusions
Annual Soil Carbon Loss No-till has significantly lower soil C losses compared to chisel plow.
Carbon Budget • C budget approach was used to estimate net ecosystem productivity (NEP) • NEPC= (ANPPC+ BNPPC) – Rh • where, • ANPPCis potential C content input from above- ground plant biomass, • BNPPCis potential C content input from below- ground root biomass, and • Rhis C loss as CO2 due to organic materials microbial decomposition. BackgroundProject Overview Grain Soil Quality Summary & Conclusions
Bulk Density BackgroundProject Overview Grain Soil Quality Summary & Conclusions
Bulk Density BackgroundProject Overview Grain Soil Quality Summary & Conclusions
Wet Aggregate Stability BackgroundProject Overview Grain Soil Quality Summary & Conclusions
Summary & Conclusions • Grain and biomass yields affected by residue removal, tillage, and N rate. • No significant change in soil organic C in the short-term. • Adoption of no-till and increased N rates did reduce some of the C losses due to residue removal. • Only with adoption of no-till and N rates greater than 150 lb/acre with very little residue removed can increase potential soil C. • Significant amount of C, N, P, and K will be removed with residue removal. BackgroundProject Overview Grain Soil Quality Summary & Conclusions
Summary & Conclusions • Increase of bulk density was observed with increase residue removal regardless of tillage and it increased with N fertilization rate. • Decreases in aggregate sizes were observed with residue removal, regardless of tillage and it increased with N fertilization rate. • Increase in N2O and CO2 emission with increased N application, residue removal, and tillage. • Regardless of tillage system only 10-20% of residue can be removed to maintain soil organic matter and soil quality. BackgroundProject Overview Grain Soil Quality Summary & Conclusions