Download
1 / 41
410 likes | 599 Vues
Scores and substitution matrices in sequence alignment. Sushmita Roy BMI/CS 576 www.biostat.wisc.edu/bmi576/ Sushmita Roy sroy@biostat.wisc.edu Sep 12 th , 2013. Key concepts in today’s class. Joint, conditional and marginal distributions Independence

E N D
Scores and substitution matrices in sequence alignment Sushmita Roy BMI/CS 576 www.biostat.wisc.edu/bmi576/ Sushmita Roy sroy@biostat.wisc.edu Sep 12th, 2013
Key concepts in today’s class • Joint, conditional and marginal distributions • Independence • Probabilistic interpretation of scores in alignment algorithms • Different substitution matrices • Assessing significance of scores • Bayesian approach
Readings • Sections 2.1, 2.2 • Sections 2.3 till end of Smith-Waterman • Section 2.7 • Section 2.8
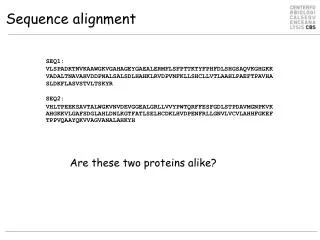
Guiding principles of scores in alignments • Sequence is said to have diverged from a common ancestor through mutations • Substitutions • Insertions and deletions (gaps) • Score evolutionarily close alignments higher than those that are not • That is we compute the likelihood ratio of an alignment given the two sequences are related versus not related
Sample spaces • Sample space: a set of possible outcomes for some event • examples • flight to Chicago: {on time, late} • lottery: {ticket 1 wins, ticket 2 wins,…,ticket n wins} • weather tomorrow: {rain, not rain} or {sun, rain, snow} or {sun, clouds, rain, snow, sleet} or…
Random variables • Random variable: represents the outcome of an experiment • Example • X represents the outcome of my flight to Chicago • we write the probability of my flight being on time asP(X = on-time) • or when it’s clear which variable we’re referring to, we may use the shorthand P(on-time)
0.3 0.2 0.1 sun rain sleet snow clouds Probability distributions • If X is a random variable, the function given by P(X = x) for each x is the probability distribution of X • Requirements:
Joint distributions • Joint probability distribution: the function given byP(X = x, Y = y) • Read “X equals xandY equals y” • Example probability that it’s sunny and my flight is on time
Marginal distributions • Themarginal distribution of X is defined by “the distribution of X ignoring other variables” • This definition generalizes to more than two variables, e.g.
Marginal distribution example joint distribution marginal distribution for X
Conditional distributions • The conditional distribution of Xgiven Y is defined as: “the distribution of X given that we know the value of Y”
Conditional distribution example conditional distribution for X givenY=on-time joint distribution
Independence • Two random variables, X and Y, are independent if
Independence example #1 joint distribution marginal distributions Are X and Y independent here? NO.
Independence example #2 joint distribution marginal distributions Are X and Y independent here? YES.
Log odds score • Let X be a random variable representing an alignment • Let M1 and M2 be two probabilistic models for X • Log odds score S(X) • If S(X)>0, X is more likely to come from model M1 • If S(X)<0, X is more likely to come from model M2
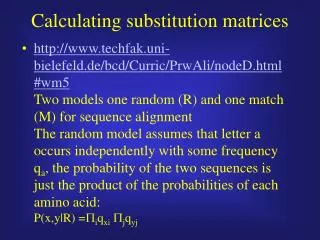
What areM1 and M2 in our sequence alignment problem • M1: foreground model, that is the sequences are “related by evolution”. • M2: background model, that is the sequences are unrelated • Need to compute the probability of an alignment X, under the two models M1 and M2 • Assume alignments on protein sequences with no gaps.
M1: foreground model • Assume each pair of aligned positions evolved from a common ancestor • Let pab be the probability of observing a pair {a,b} • Probability of an alignment betweenxand y is
M2: background model • Assume the individual amino acids at a position are independent of the amino acid in another position. • Let qa be the probability of amino acid a • The probability of an n-character alignment of x and y is
Computing the log odds ratio to score an alignment • The score of an alignment is the log odds ratio of the two sequences from M1 and M2
Computing the log odds ratio to score an alignment Score of an alignment Substitution matrix entry
Some common substitution matrices • BLOSUM matrices [Henikoff and Henikoff, 1992] • BLOSUM45 • BLOSUM50 • BLOSUM62 • Number represents percent identity of sequences used to construct substitution matrices • PAM [Dayhoff et al, 1978] • Empirically, BLOSUM62 works the best
How to estimate the probabilities? • Need a good set of confirmed alignments • Depends upon what we know about when the two sequences might have diverged • pab for closely related species is likely to be low if a !=b • pab for species that have diverged a long time ago is likely close to the background.
Dayhoff Point accepted mutation (PAM ) matrix • Substitution data from very similar/evolutionary close proteins • 71 protein sequences • Estimate ancestral sequence based on parsimony • We will look at this in detail in Phylogenetic trees • Estimate Aabthe frequency of observing a,bpairin ancestor child pairs. • Derive a conditional probability ofP(a|b) for unit time. • Derive a condition probability for longer time by taking powers of the conditional probability matrix.
Calculating Dayhoff PAM matrices Ancestral points A Count number of amino acid pairs for each ancestor – child pair D A D D Total number of observed a,b pairs Conditional probability in unit time
BLOSUM matrices • BLOck Substitution Matrix • Derived from a set of aligned ungapped regions from protein families called BLOCKS • Cluster proteins such that they have no less than L% of similarity • Calculate substitution frequencies Aab of observing a in one cluster and b in another cluster
Different BLOSUM matrices • BLOSUM50 • Proteins >50% similarity are in the same group • BLOSUM62 • Proteins >62% similarity are in the same group
Conserved blocks AABCDA...BBCDA DABCDA.A.BBCBB BBBCDABA.BCCAA AAACDAC.DCBCDB CCBADAB.DBBDCC AAACAA...BBCCC Block1 Block2 From Ron Shamir’s lecture http://www.cs.tau.ac.il/~rshamir/algmb/98/scribe/html/lec03/node10.html
Calculating the probabilities : Number of ab pairs in the kth column of a block AABCDA...BBCDA DABCDA.A.BBCBB BBBCDABA.BCCAA AAACDAC.DCBCDB CCBADAB.DBBDCC AAACAA...BBCCC
Estimating significance of scores • How do we know whether a given alignment score is random or significant? • Two approaches • Bayesian Approach • A classical approach: the extreme value distribution
Bayesian approach • Recall in our log odds ratio we estimated • We could instead ask what is the probability of the two sequences being related as opposed to unrelated Related Unrelated
Bayes theorem • An extremely useful theorem • There are many cases when it is hard to estimate P(x| y) directly, but it’s not too hard to estimate P(y| x) andP(x)
Bayes theorem example • MDs usually aren’t good at estimating P(Disorder| Symptom) • They’re usually better at estimating P(Symptom| Disorder) • If we can estimate P(Fever| Flu) and P(Flu) we can use Bayes’ Theorem to do diagnosis
Using Bayes Rule to estimate P(M1|x,y) Bayes rule Marginalization Chain Rule
Using Bayes Rule to estimate P(M1|x,y) Bayes rule Marginalization Chain Rule Model priors
Points about P(M1|x,y) • Has the form of a logistic function where Alignment score Prior log odds score
Points about P(M1|x,y) • The prior log odds score is added to the sequence score • This can be used to encode our prior belief of expected number of matches • In fact the prior log odds score should be inversely related to the number of sequences we have in a database
The classical approach to assessing sequence :Extreme Value Distribution • Suppose we have a particular substitution matrix and amino-acid frequencies • We need to consider random sequences of lengths m and n and finding the best alignment of these sequences • This will give us a distribution over alignment scores for random pairs of sequences • If the probability of a random score being greater than our alignment score is small, we can consider our score to be significant