Download

1 / 37
370 likes | 535 Vues
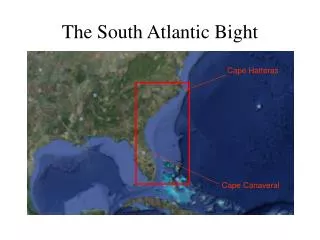
South Atlantic oceanographic and meteorological characteristics. Claudia Schmid (NOAA/AOML, USA). Outline. Hydrography & Water masses Circulation: surface intermediate depth THC & inter-ocean exchange Atmosphere ocean interaction & Meteorology upwelling off Africa forcing the circulation

E N D
South Atlantic oceanographic and meteorological characteristics Claudia Schmid (NOAA/AOML, USA)
Outline • Hydrography & Water masses • Circulation: • surface • intermediate depth • THC & inter-ocean exchange • Atmosphere ocean interaction & Meteorology • upwelling off Africa • forcing the circulation • correlations • South Atlantic tropical storms
Water masses Peterson & Withworth (1989)
Meridional sections 30W 1E 27.00 27.18 27.35
Zonal section at about 30oS 27.00 27.18 27.35
Mean zonal currents at 35oW Velocities in 700-900m EIC was defined as the westward flow under the EUC. EDJ make it hard to derive mean currents below the EUC due to their poorly understood variability on seasonal to interannual time scales. Schott et al (2003)
Intermediate depth circulation Nunez-Riboni et al. (2005)
Conveyor belt After Broecker (1991)
THC in the South Atlantic The compensating meridional flows NADW (>2000m) AAIW (500-1200m) SACW (100-500m) After Stramma & England (1999)
Transports (from Gordon et al., 1992) T>9oC: ~63% from IO T<9oC, p>1500dbar: ~56% from IO Donners and Drijfhout (2004)
Transports from OCCAM T>9oC: ~73% from IO T<9oC, p>1500dbar: ~69% from IO Donners and Drijfhout (2004)
Intermediate depth transports (Schmid et al., 2000) AAIW: <=45% from IO?
Eddies in the Agulhas Region Boebel et al. (2003)
Ring A Schmid et al. (2003)
Wind and SLP anomaly off Africa January–March 2000 falls within the protracted 1998–2001 La Nina -> high pressure anomaly in mid-latitude South Atlantic and South Indian Oceans and low pressure anomaly over southern Africa, stronger easterlies over Benguela region. Risien et al.(2003)
Upwelling regions off Africa & wind variability Variability at periods: 4 – 16 days in 10-23.5oS 4-12 and 25-50 days in 24-35oS 12oS 17oS Benguela 22oS 26oS 31oS 34oS pulses of stronger winds during the April–October 2000 period Risien et al.(2003) Lutjeharms and Meeuwis (1987)
Angola-Benguela Front quiescent situation after strong upwelling John et al. (2004)
Angola-Benguela Front SST and faunistic advection due to the anticyclonic circulation off Angola. John et al. (2004)
Correlation of SSTA and Wind Enfield and Mestas-Nunez (2000)
SSTA and SLPA maxima of SST coincide with regions in which the pressure has a large gradient Sterl and Hazeleger (2003) Based on 52 years of data (1949–2000) from the NCEP/NCAR Reanalysis (Kalnay et al. 1996).
Lagged regression SSTA (colors) and SLPA (10 hPa) Build-up and destruction of the anomalies takes 6 months. Relationship strong during build-up, weak during destruction phase. Sterl and Hazeleger (2003)
Lagged regression SSTA (colors) and total heat flux (3e+7 Km/s) wind stirring (3e+7 Km/s) Heat flux acts to dampen (positive heat flux -> cooling) or enhance (negative heat flux) the SSTA anomalies. the regions of maximum SSTA and maximum wind stirring are displaced relative to one another Sterl and Hazeleger (2003)
Lagged regression SSTA (colors) and Ekman pumping (1e+7 Km/s) merid. Ekman Tr. (1e+7 Km/s) Impacts of Ekman heat transport and Ekman pumping are at least a factor of three smaller than heat flux. Sterl and Hazeleger (2003)
South Atlantic SSTA+ dipole Haarsma et al (2003)
MSLP anomaly 200 hPa streamfunction anomaly Atmospheric pressure and wind anomalies in response to the SSTA+ dipole Most prominent is the response centered at 30W 15S during the austral summer (Jan.–March), mainly due to the equatorward SSTA pole (anomalous low MSLP and cyclonic circulation, anomalous anticyclonic circulation at 200 hPa). Haarsma et al (2003)
precipitation (mm/day) near surface wind (m/s) Anomalies of precipitation and near-surface wind in response to the SSTA+ dipole Anomalous low (high) precipitation associated with anomalous advection of moisture (dry -> N, moist -> S) causing anomalous down- (up-) welling -> ITCZ is displaced southward towards warm SSTA. Haarsma et al (2003)
Anomaly of NSHF Anomaly of total cloud cover Anomalies of net upward surface heat flux and cloud cover in response to the SSTA+ dipole Shift of ITCZ -> shift of cloud cover, but no significant change of NSHF since SSTA is too far south. Over the SSTA anomalies significant NSHF change mainly due to latent heat flux. Haarsma et al (2003)
South Atlantic tropical cyclones • Angola tropical depression, April 10-15, 1991 (cyclone on 13.?) – for now the only one in the eastern South Atlantic • Tropical depression, January 18-21 (cyclone on 19.?) southeast of Salvador, Brazil • Hurricane Catarina March 22-28, 2004 • 2006: two short-lived tropical/subtropical systems were observed over 27oC water in a region of strong wind shear (Jeff Masters, www.wunderground.com): • February 23 near 29S, 36W (600 miles SE of Rio de Janeiro), survived about 4 hours • March 15 off South Brazil
Hurricane Catarina Mean SST for March 21-28, 2004. Circle indicates Storm location on March 26. animation