Download
1 / 10
100 likes | 187 Vues
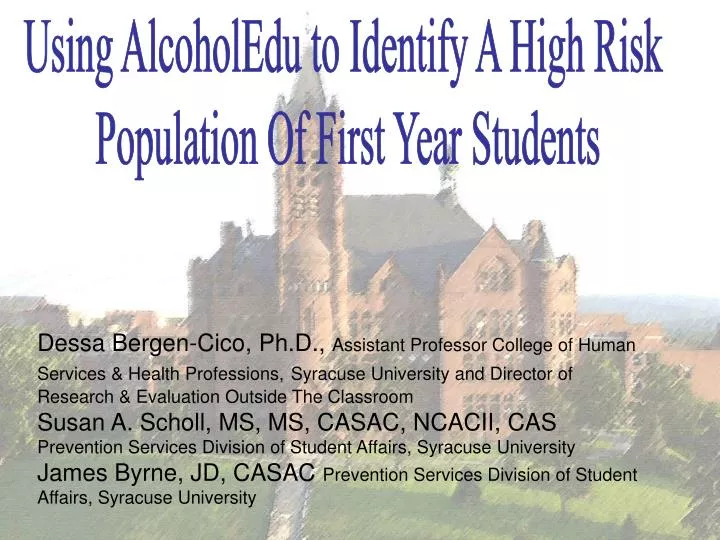
Using AlcoholEdu to Identify A High Risk Population Of First Year Students. Dessa Bergen-Cico, Ph.D., Assistant Professor College of Human Services & Health Professions, Syracuse University and Director of Research & Evaluation Outside The Classroom

E N D
Using AlcoholEdu to Identify A High Risk Population Of First Year Students Dessa Bergen-Cico, Ph.D., Assistant Professor College of Human Services & Health Professions,Syracuse University and Director of Research & Evaluation Outside The Classroom Susan A. Scholl, MS, MS, CASAC, NCACII, CAS Prevention Services Division of Student Affairs, Syracuse University James Byrne, JD, CASAC Prevention Services Division of Student Affairs, Syracuse University
AlcoholEdu Based on Population Level Prevention Social Cognitive Theory Diffusion of Innovation Tipping Point Herd Immunity
COLLEGE EFFECT Documenting College Effect 2006 Alcohol Consumption Changes In press do not cite without author’s permission Winsor, Bergen-Cico, Meilman
Expected Value Calculation E X N = EV E= Percent of first year class seen at Options N= Number of non-completers in first year class EV= Number of non-completers seen at Options, if the failure to complete AlcoholEdu means nothing A= Actual number of non-completers seen in the first year class at Options 2003 3.9% X 486 = 19 (A= 35, which is 185%EV) 2004 3.5% X 318 = 11.13 (A=30, which is 270% EV) 2005 4.5% X 232 = 10.4 (A=30, which is 288% EV)