Download
1 / 30
310 likes | 522 Vues
Cost Analysis and Estimation. Chapter 6. ATC. MC. AVC. AFC. Economic Costs. ...are Opportunity Costs. Economic Costs. Explicit Costs payments a firm must make Implicit Costs opportunity costs of firm’s own resources include normal profits. Total Revenue. $120,000. Cost of T. -.

E N D
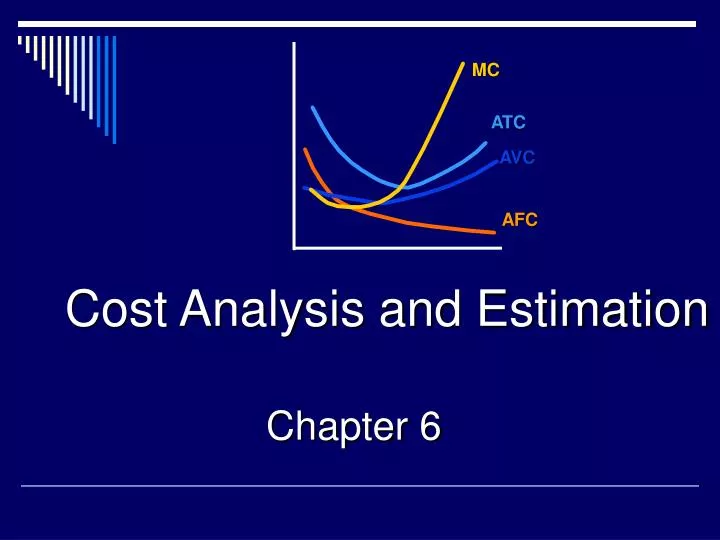
Cost Analysis and Estimation Chapter 6 ATC MC AVC AFC
Economic Costs... ...are Opportunity Costs
Economic Costs Explicit Costs • payments a firm must make Implicit Costs • opportunity costs of firm’s own resources • include normal profits
Total Revenue $120,000 Cost of T - shirts $40,000 Clerk's salary $18,000 Utilities $ 5,000 Total (explicit) costs $ 63,000 Accounting Profit $ 57,000 Normal Profit as a Cost
Total Revenue $120,000 Cost of T - shirts $40,000 Clerk's salary $18,000 Utilities $ 5,000 Total (explicit) costs $ 63,000 Accounting Profit $ 57,000 Forgone interest $ 1,000 Forgone rent $ 5,000 Forgone wages $2 2 ,000 Normal profit $ 5,000 Total implicit c osts $ 3 3 ,000 Economic profit $ 24,000 Normal Profit as a Cost
Normal Profit as a Cost • Costs of production include all costs • explicit & • implicit • including a normal profit required to attract & retain factors of production economic profit = total revenue – economic cost
Profits to an Accountant Profits to an Economist Economic Profits Accounting Profits Implicit costs (including a normal profit) Total Revenue Economic (opportunity) Costs Accounting costs (explicit costs only) Explicit Costs
How Is the Operating Period Defined? Short Run Versus Long Run At least one input is fixed in the short run. All inputs are variable in the long run. Fixed and Variable Costs Fixed cost is a short-run concept. All costs are variable in the long run.
Short-run Cost Curves Short-run Cost Categories Total Cost = Fixed Cost + Variable Cost For averages, ATC = AFC + AVC Marginal Cost, MC = ∂TC/∂Q Short-run Cost Relations Short-run cost curves show minimum cost in a given production environment.
ATC AVC Price ($ per unit) MC Output
Long-run Production Costs • What will costs look like when the firm can choose the best plant size for any given situation? • For every plant capacity size, there is a short-run ATC curve • All such plant capacities can be plotted....
Firm Size & Costs ATC-4 ATC-3 ATC-1 ATC-2 ATC-5 choose the best plant for every output level
Firm Size & Costs ATC-4 ATC-3 ATC-1 ATC-2 ATC-5
The Long-run Cost Curve LRATC these choices determine the LRATC curve
The Long-run Cost Curve the number of possible plant sizes is virtually unlimited
The Long-run Cost Curve LRATC the LR ATC curve just envelops the short-run cost curves
The Long-run Cost Curve LRATC
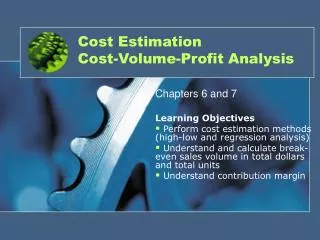
Long-run Cost Curves Long-run total cost curves show minimum total cost in an ideal environment. Economies of Scale Increasing returns to scale imply falling average costs. Constant returns to scale implies constant average costs. Decreasing returns to scale implies rising average costs.
Economies & Diseconomies of Scale Economies of scale LRATC
Economies & Diseconomies of Scale Constant returns to scale Economies of scale LRATC
Economies & Diseconomies of Scale Constant returns to scale Economies of scale Diseconomies of scale LRATC
Cost Elasticities and Economies of Scale Cost elasticity measures the percentage change in cost following a one percent change in output. εC = ∂C/C ÷ ∂Q/Q. Cost elasticity measures returns to scale. εC < 1 means increasing returns (falling AC). εC = 1 means constant returns (constant AC). εC > 1 means decreasing returns (rising AC).
Learning Curves Learning Curve Concept Learning causes an inward shift in the LRAC curve due to better production knowledge. Learning is often mistaken for scale economies. Strategic Implications of the Learning Curve Concept If learning results in 20% to 30% cost savings, it becomes a key part of competitive strategy.
LRAC2 Economies of Scale A B LRAC1 Learning C Economies of Scale Versus Learning Cost ($ per unit of output) Output
Economies of Scale • Labour specialization • Managerial specialization • Efficient capital • Other factors
Minimum Efficient Scale ATC-4 ATC-3 ATC-1 ATC-2 ATC-5 MES is the smallest level of output that minimizes LRATC
Minimum Efficient Scale • relatively large MES • natural monopoly LRATC MES
Minimum Efficient Scale LRATC • relatively small MES • competitive industry MES