Download
1 / 34
340 likes | 347 Vues
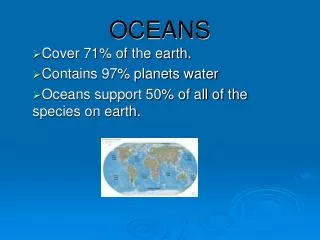
Explore the origin of Earth's oceans, the movement of ocean water, the formation of waves, and the major currents. Discover why the ocean has ice, why ocean water is salty, and how the ocean supports life.

E N D
Interested in Oceanography? Suggested textbook: Gross, Grant and Elizabeth Gross, 1996: Oceanography, A View of Earth (Prentice-Hall). GMU offers GEOL309 Introduction to Oceanography … please see Prof. McBride
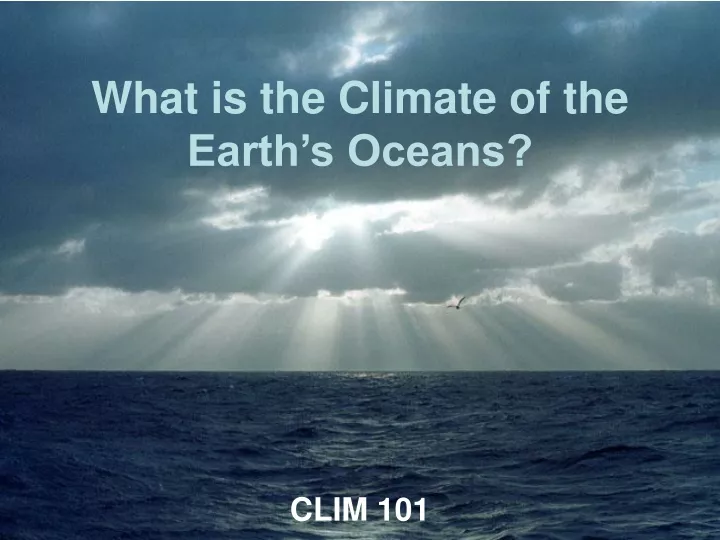
Questions What is the origin of Earth’s oceans? Why does the ocean water move? Where do the waves at the beach come from? What are the major currents? Why are there eddies and loop currents? Where does the ocean have ice? Why? Why is ocean water salty?
Origin of the Oceans Water on Earth primarily originated as steam from volcanoes in the slowly cooling Earth’s crust. After the Earth's surface had cooled to a temperature below the boiling point of water, rain fell for millennia. As the water drained into the great hollows in the Earth's surface, the primeval ocean came into existence. The geographic form of the Earth’s oceans arises from continental drift that is associated with convection in the Earth’s mantle and the movement of segments of the Earth’s crust “floating” on the mantle called plates BREAK FOR CLIMAP SLIDESHOW
Continental Drift and Climate • Continents may drift toward the poles • Land serves as a platform for ice formation cooler climate • Continents may drift apart to open ocean currents • E.g., Southern Ocean opened when Antarctica separated from South America • Reduced poleward oceanic heat transport cooler climate • Continents may drift together closing off ocean currents • E.g., isthmus of Panama formed when North and South America came together • May cut off the flow from west to east • Stronger western boundary current (Gulf Stream) • Increased oceanic heat transport warmer climate Uplift of Tibetan Plateau Indian monsoon • Increased rainfall in south and southeast Asia • Increased subsidence & less rainfall over Mediterranean • Warm rain increased weathering decreased CO2 cooler climate • NOTE: on time scales of 106 years, atmospheric CO2 concentration is determined by balance of weathering and metamorphosis (subduction) • Increased sea floor spreading • Increased volcanism increased CO2 • Increased/decreased sea/land area decreased weathering increased CO2 warmer climate
Questions What is the origin of Earth’s oceans? Why does the ocean water move? Where do the waves at the beach come from? What are the major currents? Why are there eddies and loop currents? Where does the ocean have ice? Why? Why is ocean water salty? How does the ocean support life?
The Climate of a Planet Depends On … Energy from the Sun (+ energy from the interior) Planetary Albedo Speed of Planet’s Rotation Mass of the Planet Radius of the Planet Atmospheric Composition Ocean-Land, Topography S M r H2O, CO2, O3, clouds h*
S, , a, g, Ω O3 H2O CO2 Ω CLIMATE DYNAMICS OF THE PLANET EARTH g (albedo) Gases: H2O, CO2, O3 S r T4 h*: mountains, oceans (SST) w*: forest, desert (soil wetness) CLIMATE . stationary waves (Q, h*), monsoons WEATHER hydrodynamic instabilities of shear flows; stratification & rotation; moist thermodynamics day-to-day weather fluctuations; wavelike motions: wavelength, period, amplitude
What Drives the Oceans? • Energy from the Sun as well as (radiative and sensible) energy from the atmosphere warms the surface of the ocean • Winds blowing across the ocean surface produce currents and waves • Motions (waves and currents) transport heat, salt from one place to another • Variations in water density due to changes in temperature or salinity also produce motions (thermohaline circulation) • Where the energy balance acts to cool the surface sufficiently, ice can form, which is then transported by currents and winds
Why Are the Oceans Salty? • Salinity: number of grams of salts dissolved in 1 kilogram of seawater. A typical value of salinity is 35 (35 o/oo), which means that about 3.5% of the weight of seawater is due to salt. • If the salt in the sea could be removed and spread evenly over the Earth's land surface it would form a layer more than 150 m thick (about the height of a 40-story building). Ocean water is, on average, over 200 times saltier than a freshwater lake (even the freshest water has some dissolved salts in it). • The dissolved salts come from gradual processes such the breaking up of the cooled igneous rocks of the Earth's crust by weathering and erosion, the wearing down of mountains, and the dissolving action of rains and streams. • The world’s rivers annually transport an estimated 4 billion tons of dissolved salts to the oceans. About the same amount of salt probably is deposited as sediment on the ocean bottom each year. Since the difference between evaporation and precipitation over the ocean is about the same as the fresh water transport to the oceans from rivers, the salinity remains balanced on an annual basis. Over much longer time periods, the oceans are getting saltier, because erosion is slowly grinding the mountains into the oceans.
Salinity - Effects on Oceans and Climate • The presence of salts influences most physical properties of sea water (density, compressibility, freezing point, temperature of the density maximum, conductivity, osmotic pressure). Salinity does not significantly affect viscosity, light absorption. • The saltiest water (40 parts per thousand or 40 o/oo) occurs in the Red Sea and the Persian Gulf, where there is little rainfall and rates of evaporation are high. Of the major oceans, the North Atlantic is the saltiest (on average 37.9 o/oo). Dead Sea (salinity 319 o/oo; density 250)
Global Statistics • The mean temperature of the world ocean is 3.5oC and the mean salinity is 34.7 (Even at the equator the average temperature is as low as 4.9°C) • 50% of the total volume of the oceans has temperature between 1.3oC and 3.8oC and salinity between 34.6 and 34.8 • Both temperature and salinity are quite uniformly distributed below 1000 m depth • Volumetric temperature-salinity diagram of the world ocean: • 75% of the ocean's water have a temperature and salinity within the green region • 99% have a temperature and salinity within the region colored in cyan • The warm water outside the 75% region is confined to the upper 1000 m of the ocean From M. Tomczak, 1996: Introduction to Physical Oceanography (http://gaea.es.flinders.edu.au/~mattom/IntroOc)
Terms • Some water properties have a distinct tendency to be zonal (i.e., change in east-west direction is much smaller than in north-south) - we tend to label water masses and properties by their north-south position • Equatorial: the zonal within several degrees of the equator • Tropical: zones within the tropics (within 23o latitudes of the equator, usually refer to the processes extending outside the equatorial zone) • Low latitude: equatorial + tropical • Subtropical: mid-latitude zones poleward of tropics • Temperate zones: between 30o-60o latitude bands (with most marked seasonal changes) • Mid-latitudes: subtropical and temperate zones • Polar: Arctic and Antarctic regions • Subpolar: the region between the strictly polar conditions and those of the temperate mid-latitudes • High latitudes: near poles (~ polar+subpolar)
Earth’s Oceans • Sea surface temperature • Sea surface salinity (relation to P-E) • Ocean color (phytoplankton) • Ocean currents (associated with wind stress) • Vertical distribution of temperature (atmospheric profile as reminder) • Variability - El Nino, Atlantic, Indian, PDO
Earth’s Oceans • Sea surface temperature • Sea surface salinity (relation to P-E) • Ocean color (phytoplankton) • Ocean currents (associated with wind stress) • Vertical distribution of temperature (atmospheric profile as reminder) • Variability - El Nino, Atlantic, Indian, PDO
Mean Sea Surface Temperature (SST) • roughly zonal (east-west) isotherm • meridional gradient follows solar radiation • diverted equator-ward near the eastern coast (cold tongues) • warm pool: SST > 28oC • sea ice at high latitudes (about -1.8oC) CPC Analysis, January 1982-December 2001
SST Annual Cycle • Amplitude • Equator: 1o-2oC • Mid-latitudes: 5o-10oC • Near poles: reduced (melting and freezing of sea ice) • Near coasts: 10o-20oC • Evolution • maximum SST: Aug/Sep (N. Hem.) • minimum SST: Feb/Mar (N. Hem.) • Annual cycle decreases rapidly with depth: confined mostly above 100; little change below 200 meters Departure of monthly climatology from climatological annual mean (based on CPC data, 1982-2001)
Earth’s Oceans • Sea surface temperature • Sea surface salinity (relation to P-E) • Ocean color (phytoplankton) • Ocean currents (associated with wind stress) • Vertical distribution of temperature (atmospheric profile as reminder) • Variability - El Nino, Atlantic, Indian, PDO
Mean Sea Surface Salinity (SSS) • SSS distribution is mostly zonal (range: 33-37 o/oo) • Minimum north of the equator (ITCZ) • Maximum in subtropics (trade winds) • Lower around coasts (river) and poles (melting ice) • Mediterranean, 39 o/oo and Red Sea, 41 o/oo (large evaporation ) NODC WOA98, Levitus et al.
SSS distribution in open ocean is closely linked to precipitation and sea surface evaporation From Pickard and Emery: Descriptive Physical Oceanography: An Introduction
Earth’s Oceans • Sea surface temperature • Sea surface salinity (relation to P-E) • Ocean color (phytoplankton) • Ocean currents (associated with wind stress) • Vertical distribution of temperature (atmospheric profile as reminder) • Variability - El Nino, Atlantic, Indian, PDO
Ocean Color - Chlorophyll (SeaWIFS) Jan Jul Apr Oct
Earth’s Oceans • Sea surface temperature • Sea surface salinity (relation to P-E) • Ocean color (phytoplankton) • Ocean currents (associated with wind stress) • Vertical distribution of temperature (atmospheric profile as reminder) • Variability - El Nino, Atlantic, Indian, PDO
Winds over the Ocean - Quickscat Jan mean 01 Jun 1999
Winds over the Ocean - Quickscat Jul Jan
Schematic Picture of the Major Surface Currents of the World Oceans Note the anticyclonic circulation in the subtropics (the subtropical gyres)
Surface Ocean Currents Note the anticyclonic circulation in the subtropics (the subtropical gyres)
Surface winds and oceanic gyres: A more realistic view Note that the Equatorial Counter Current is against the direction of prevailing wind.
The effect of winds on the vertical movement of water Upwelling along the coast caused by Ekman transport of waters (waters move to the right of the wind). The waters moved offshore are replaced by waters from below. This brings cold, nutrient rich waters to the surface. Downwelling caused by Ekman transport onshore (movement of water to the right of the wind direction).