Download
1 / 13
130 likes | 270 Vues
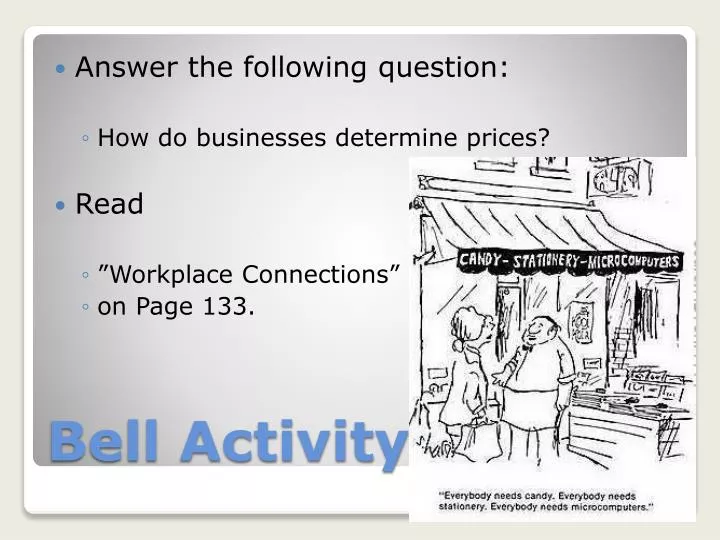
Answer the following question: How do businesses determine prices? Read ”Workplace Connections” on Page 133. Bell Activity. Business Economics. Chapter 6 Monday, October 12, 2009. Bell Activity Preview, Read and Discuss Chapter 6 Supply and Demand Activity

E N D
Answer the following question: • How do businesses determine prices? • Read • ”Workplace Connections” • on Page 133. Bell Activity
Business Economics Chapter 6 Monday, October 12, 2009
Bell Activity • Preview, Read and Discuss Chapter 6 • Supply and Demand Activity • Assessment – Focused Free Write • Home work Today’s Agenda 10/12/2009
Reading Activity – Three Level Study Guide • Preview guide • As you read, reference 3 Level SG • List page and paragraph for each to verify • In your group, discuss whether the statement should be checked or not. Making Decisions in a Market Economy
Teamwork • Pair up with the person to your right and create a graph showing supply, demand, and equilibrium price for a good or service of your choice. Be sure to use reasonable prices. Making Decisions in a Market Economy
Complete Section 6.1 Assessment P. 143 • Fact and Idea Review • Critical Thinking Making Decisions in a Market Economy
Daily Supply Curve of Hamburgers • At higher prices, sellers generally offer more units for sale. The supply curve is upward sloping. This is based on the logical assumption that people will be wiling to produce and sell goods as long as the price they received for these goods is sufficient to cover the opportunity cost of supplying them.
The Daily Demand Curve for Hamburgers • The demand curve for any good is generally a downward-sloping function of its price. At lower prices, buyers generally want to purchase more units.
The Equilibrium Price and Quantity of Hamburgers • The equilibrium quantity and price of a product are the values that correspond to the intersection of the supply and demand curves for that product.
Excess Supply • When price exceeds the equilibrium price, there is excess supply, or surplus, that is equal to the difference between quantity supplied and quantity demanded. Excess supply = 8000 hamburgers/day Supply Demand
Excess Demand • When price lies below the equilibrium price, there is excess demand, the difference between quantity demanded and quantity supplied. Supply Excess demand = 8000 hamburgers/day Demand