Download
1 / 9
90 likes | 268 Vues
Costo para Producción Eléctrica. METODO Costos* (EURO-Cent) por kWh Min. Max. Carbón 3 4 Lignita 3 5 Gas Natural 3 4 Foto Voltaico 34 72

E N D
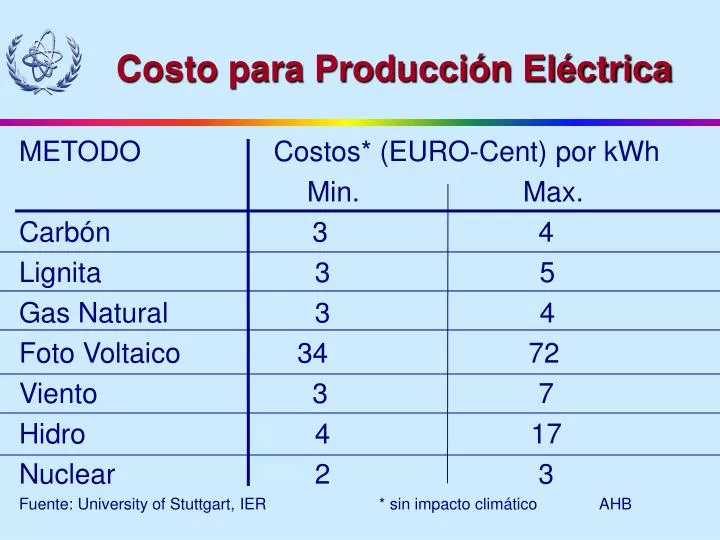
Costo para Producción Eléctrica METODO Costos* (EURO-Cent) por kWh Min. Max. Carbón 3 4 Lignita 3 5 Gas Natural 3 4 Foto Voltaico 34 72 Viento 3 7 Hidro 4 17 Nuclear 2 3 Fuente: University of Stuttgart, IER * sin impacto climático AHB
Medida de Operación a Maxima Carga METODO Medida alcanzable de Operación a Max. Carga en un año (h/a) Carbón 8000 Gas Natural (CC) 8000 Foto Voltaico (Alemania) 1200 (California) 2500 Viento 2500 Hidro 5000 Nuclear 8000 Fuente: Siemens KWU, 1999 Ing. Alvaro Bermudez
Production de Residuos • Comparacion de carbón quemado y planta nuclear 1000 MWe Planta a Carbón Nuclear Combust. Consum. p/Día 7000 tons 0,08 tons Residuos p/año 900 tons de SO2 20 tons de residuos. 4500 tons de NOx 6,5 millon tons de CO2 400 tons de metales pesados Fuente: Vattenfall Fuel, IC on Innovative Nuclear Power, Vienna, 2003 Ing. Alvaro Bermudez
Existencia de Combust. Nuclear • Reservas estimadas de uranio Categoria Mio tU Años(con el consumo actual) Stocks 0,2 3 Materiales de Armamento 0,6 9 Conocidos en tierra 4,5 70 Estimado en tierra 11 170 Estimatdo en fosfatos 22 340 Agua de mar 4000 60000 • Estimadas reservas suficientes para 250 years • Con Reciclaje de Uranio y Plutonio 10000 years Fuente: Vattenfall Fuel, IC on Innovative Nuclear Power, Vienna, 2003 AHB
La Realidad de Energías Renovables • Fuente: Entergy Nuclear, GENES4/ANP2003, Kyoto (square kilometers) = 104 - 180
Emisión de CO2 para diferentes fuentes de energía • Emisión de CO2ciclo de combustible nuclear (desde minería hasta residuo) por kWeh producido: 10 – 50 g/kWeh • Emisión de CO2 de energía eólica: 10 – 50 g/kWeh • Emisión de CO2 de ciclo de combustiblefósil: 450 – 1200 g/kWeh Fuente: Vattenfall Fuel, IC on Innovative Nuclear Power, Vienna, 2003 AHB
Cost Ranges* [USD/MWh] 5 % 10 % 60 40 Gas Gas Nuclear Coal 20 Nuclear Coal 0 * Excluding the 5% highest and 5% lowest values