Download
1 / 36
360 likes | 519 Vues
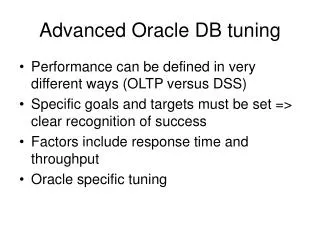
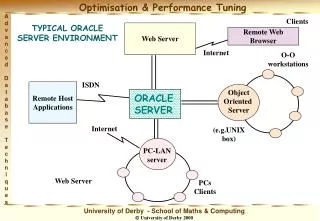
Oracle Server Tuning Accelerator. David Scott Intec. Tuning Metaphors. Body / Doctor Auto / Mechanic. The Right Solution. Fixes the immediate problem Prevents a recurring problem Fixes the underlying problem Is found and implemented quickly Is cost-effective Is properly documented

E N D
Oracle Server Tuning Accelerator David ScottIntec
Tuning Metaphors • Body / Doctor • Auto / Mechanic
The Right Solution • Fixes the immediate problem • Prevents a recurring problem • Fixes the underlying problem • Is found and implemented quickly • Is cost-effective • Is properly documented • Has measurable ROI
“It’s Slow!” - Triage • Compared to what? What is “Normal”? • Do you have benchmarks? • What has changed in the environment? • And when? • Are you processing the right data? • Which part of the system is slow? • most expensive / most used queries • Concentrate effort on items with most business impact.
Basic Approach • Define the business problem • Measure the pain • Identify the problem component • Find the root cause • Investigate and weigh solutions • Fix the problem • Measure the results
Case Study #1 p1 • Define the BUSINESS problem • The GUI is too slow; a loss in productivity $$$ • Measure the pain • Screen XYZ in the GUI takes 47 seconds • 3000 users use this screen at each login • Most other screens are fine • Identify the problem component • Stopwatch timing of XYZ response is 47 seconds • Same SQL query takes 47 seconds • Query identified as culprit
Case Study #1 p2 • Find the root cause • Inefficient query • Investigate and weigh solutions • Multiple versions of query compared • Results must match original • Fix the problem • Replace query in Screen XYZ with tuned version • Measure the results • Query returns in 2 seconds • ROI: 3000 users * 45 seconds saved * Avg salary @ $10/hour * 260 business days/year = $97,500
Case Study #2 p1 • Define the BUSINESS problem • Processing 40M rows exceeds operational window • Measure the pain • Users cannot begin sessions until 10-11 AM • Cost = 2-3 hours overtime for 2 people per day • Identify the problem component • Main processing routine takes > 4 hours/day
Case Study #2 p2 • Find the root cause • UPDATE of records in main table is not appropriate for increased workload (maximum 1200 rows/second) • Investigate and weigh solutions • Used tracing, tkprof, Explain Plan • Fix the problem • Rewrite using partitioned staging tables and INSERT /*+APPEND */ • Measure the results • Average run is < 2 hours (average 3600 rows/second) • Processing completes before users arrive
Where’s the Wait? Database Network ClientApplication CPU Disk
Finding Out “What’s Wrong” • Guessing… (from experience, of course) • Old wive’s tales and “Rules of Thumb” • Trial and Error • Statspack • Using the V$ Tables • Cache Hit and other ratios • Top SQL (cost, # executions, logical/physical I/O) • Explain Plan • Are indexes always “good”? Are they used? • Profiling and Tracing • Autotrace, Event 10046 • Wait Events
Investigative Arsenal • SQL*Plus • Docs • Performance Tuning Guide and Reference • Wait event reference • Database Reference • Init.ora parameters, V$ view listings • Tkprof • TOAD, OEM, etc (optional) • OS tools: vi, iostat, sar, etc.
Fixing “What’s Wrong” • Change the database configuration: init.ora • Statistics • Make better choices, I/O speed is unchanged • Outlines • Rewrite • Parallel operations • Hints • More efficient plans • Re-architect / Rebuild
Pitfalls • Risk: Wasting time chasing a hunch • Problem: fixing before finding out! • jumping to conclusions • Problem: “It can’t hurt…” • Yes, it can. • Problem: Multiple changes at once • Which one ‘fixed’ it? • Side effects (What else did you break?)
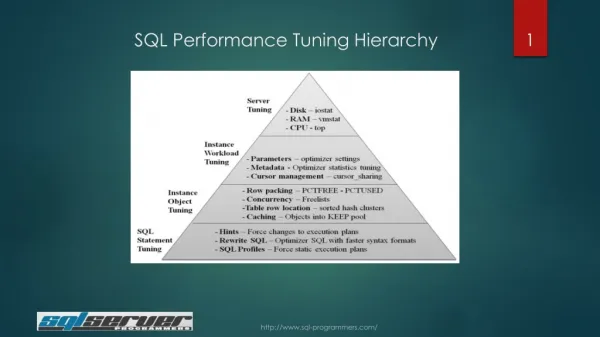
Which Approach, When? • Massive problems, entire computer • OS tools, Configuration parameters • Entire database is slow, no clues • Statspack, V$ views • This query or batch is slow • Autotrace, V$, Tracing, Wait Events
OS Tools • Basic observation of resources and processes • top • sar • iostat • ps –ef • ipcs
Configuration Parameters • Use AUTO parameters where possible • Override only when needed • Have a good reason • Remove deprecated parameters • Check COMPATIBLE
Parameter Resources • Oracle 9i Database Reference Guide, Chapter 1 • The usual websites… • Oracle Initialization Parameters Pocket Reference by David C. Kreines, O’Reilly Press
Statspack • What is it? • How to install it? • How to gather data? • What is reported? • How to report on the data?
Statspack: What is it? • System-wide stats and ratios • Based on bstat / estat • Point-in-time snapshots • Automated via DBMS_JOBS • Many options and settings
Statspack: Installation • Login as a sysdba • @?/rdbms/admin/spcreate.sql • Follow prompts for user, pw, tablespaces • Set TIMED_STATISTICS=TRUE • Set JOB_QUEUE_PROCESSES=1 or more • Total setup time: about 2 minutes!
Statspack: Gather Data • Manual • EXEC STATSPACK.SNAP; • Better:SQL> var snap number;SQL> exec :snap := statspack.snap;SQL> print snap • Automated (every hour on the hour!) • @?/rdbms/admin/spauto.sql • Schedule to capture your workload!
Statspack Content • Level >= 0 • General Performance Statistics • Level >= 5 • SQL Statement Stats • Level >= 6 • SQL Plans and Plan Usage • Level >= 7 • Segment Level Stats • Level >= 10 • Parent and Child Latches
Statspack: Reports • Full Report: spreport.sql • STATS$SNAPSHOT for snapshot info • SQL Report: sprepsql.sql • STATS$SQL_SUMMARY for hash info • Or just run the reports; the info is displayed!
Statspack Resources • Database Performance Tuning Guide and Reference, Chapter 21 • Absolute MUST READ! • Websites • Metalink • http://asktom.oracle.com • http://otn.oracle.com • Book: • Oracle9i High-Performance Tuning with STATSPACK by Don Burleson
The V$ Views • Tons of scripts on the net! • Beware of making decisions based on summary information. • The info is ‘live’ – and changes… • Interesting views: • V$SQL, V$SQL_TEXT, V$SESSION, V$STAT_NAME, V$SORT_USAGE, V$SESSION_WAIT … and many, many more!
Autotrace • Quick plan explanation & basic statistics • To setup, see http://osi.oracle.com/~tkyte/ article1/autotrace.html • Settings • SET AUTOTRACE ON EXPLAIN • SET AUTOTRACE ON STATISTICS • SET AUTOTRACE ON • SET AUTOTRACE TRACEONLY
Explain Plan • explain plan set statement_id = ‘whatever’for <your SQL here>; • select * from table(dbms_xplan.display); • Are the plans what you expect? • Full table scans are not always ‘bad’ • See Database Performance Tuning Guide and Reference, Chapter 9
SQL Trace • Started in Oracle7 • Cryptic but useful information • Files written to UDUMP directory • Level 1 = Equal to SQL_TRACE=TRUE. • Level 4 = SQL_TRACE & bind variables. • Level 8 = SQL_TRACE & wait events. • Level 12 = Combines levels 4 & 8.
Wait Events • Identify where time is spent waiting for work • Viewable in V$SESSION_WAIT • join to V$SESSION • Written to trace file via event 10046 • alter session set events '10046 trace name context forever, level 12'; • alter session set events '10046 trace name context off' ; • exec sys.dbms_system.set_sql_trace_in_session (sid, serial#,TRUE | FALSE);
How to Use Wait Events • Modify the process to set the event • Run the process (or part of it) • Find the trace file • Use tkprof to summarize the trace file • Find the significant statements • Identify the waits • Modify the code and/or environment
Using Tkprof • tkprof inputfile.trc outputfile • Many sorting options • I don’t bother… some folks do. • To get help, type ‘tkprof’ w/o parameters • Avoid tkprof explain=user/pw • Gives current explain plan, not actual plan • Then just vi outputfile
Tkprof Resources • Expert Oracle One-On-One by Tom Kyte • Database Performance Tuning Guide and Reference, Chapter 10 • Every performance book ever written…
10g Changes Everything (Almost) • ADDM – Automatic Database Diagnostic Monitor • Statspack, V$, and ‘OEM’ rolled into 1 place • OEM has been expanded • To be continued…
Are You Finished? • CTD – Compulsive Tuning Disorder • Document the solution • Calculate the ROI