1 / 6

Source: DOE Enrollment Data (ASAP)

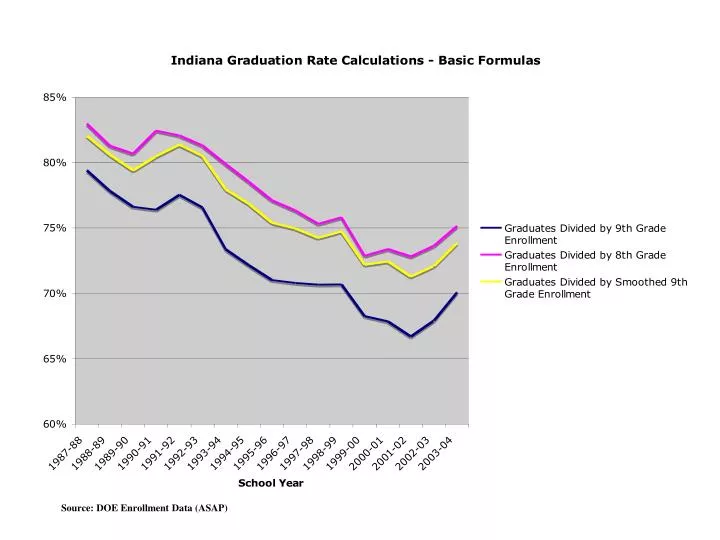
Source: DOE Enrollment Data (ASAP). Source: DOE Enrollment Data (ASAP). Source: DOE Enrollment Data (ASAP). X.

arion
Télécharger la présentation

Source: DOE Enrollment Data (ASAP)

An Image/Link below is provided (as is) to download presentation Download Policy: Content on the Website is provided to you AS IS for your information and personal use and may not be sold / licensed / shared on other websites without getting consent from its author. Content is provided to you AS IS for your information and personal use only. Download presentation by click this link. While downloading, if for some reason you are not able to download a presentation, the publisher may have deleted the file from their server. During download, if you can't get a presentation, the file might be deleted by the publisher.

E N D

Presentation Transcript


  1. Source: DOE Enrollment Data (ASAP)

  2. Source: DOE Enrollment Data (ASAP)

  3. Source: DOE Enrollment Data (ASAP)

  4. X X = 77.85%, a Proxy Calculation for the 05-06 class (using multiple cohorts not fully excluded or adjusted) under Indiana’s new statutory methodology (full 4-year) measurement will be available in Fall 2006 Source: DOE Enrollment Data (ASAP)

  5. X X = 77.85% Proxy Calculation for the 05-06 class Source: DOE Enrollment Data (ASAP)

  6. Of every 100 Indiana 9th Graders, Only … Source: National Center for Public Policy and Higher Education April 2004

More Related