Download
1 / 72
740 likes | 1.03k Vues
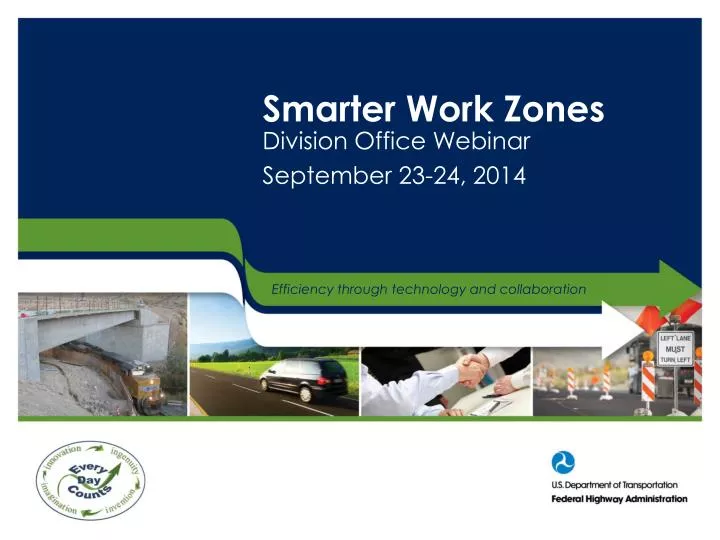
Smarter Work Zones. Division Office Webinar September 23-24, 2014. Agenda. Welcome and Introductions What are “Smarter Work Zones” (SWZ) and why are they important? What are we trying to accomplish? SWZ Project Coordination What is it? Challenges and Benefits Case Study Example

E N D
Smarter Work Zones Division Office Webinar September 23-24, 2014
Agenda • Welcome and Introductions • What are “Smarter Work Zones” (SWZ) and why are they important? • What are we trying to accomplish? • SWZ Project Coordination • What is it? • Challenges and Benefits • Case Study Example • Q&A Discussion • SWZ Technology Application • What is it? • Challenges and Benefits • Case Study Example • Q&A Discussion
Implementation Team Members Support staff includes: • Rachel Klein (Battelle, FHWA WZ Team Contract Support) • Jennifer Fenwick (ARA, FHWA CAI Team Contract Support)
Today’s Presenters Jawad Paracha Work Zone Program Manager FHWA Office of Operations Neil Boudreau State Traffic Engineer Massachusetts Dept. of Transportation
What are Smarter Work Zones (SWZ)? Innovative strategies designed to optimize work zone safety and mobility • Policies and practices used to incrementally and continuously improve WZ operations • Tools to reduce WZ crashes and delays • Tools to enhance WZ management strategies
Why are SWZs Important? Play major role in reducing WZ-related injuries, fatalities, and travel delays • Work Zone related injuries: • Occur every 14 minutes (96 injuries/day) • Over 20,000 workers injured annually • 32,000 injuries in 2012 • Work Zone related fatalities: • Occur every 15 hours (1.6 fatalities/day) • 130 worker fatalities in 2012 • 609 traffic-related fatalities in 2012 • Work Zone related mobility issues: • 24% of non-recurring delay • 10% of all congestion • NHS capacity loss ~180mil vehicles/day Source: VDOT
Two Identified SWZ Initiatives: Project Coordination • Coordination within a single project and/or among multiple projects within a corridor, network, or region, and possibly across agency jurisdictions
Two Identified SWZ Initiatives: Technology Application • Deployment of Intelligent Transportation Systems (ITS) for dynamic management of work zone traffic impacts, such as queue and speed management
How will the SWZ Initiatives be mainstreamed? • Establish goals for specified number of State DOTs to adopt activities under (at least one of) the identified initiatives: • Project Coordination • Technology Application • Monitor State DOT progress towards adoption and implementation by 12/31/2016 Goals, adoption, and deployment laid out in SWZ Implementation Plan Source: FHWA
Support Provided by FHWA Headquarters, Resource Center, and Division Office staff will be providing technical assistance to help States overcome barriers and obstacles
EDC-3 SWZ Summit Information • *Smarter Work Zone Sessions to be broadcast • Oct 21st - 1:00 PM – 2:45 PM (ET) • Nov 14th - 8:00 AM – 9:45 AM (ET) • http://www.fhwa.dot.gov/everydaycounts/summits/edc-3.cfm
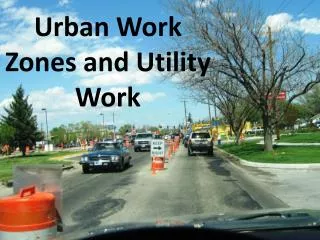
Project Coordination – What is it? Coordination within a single project and/or among multiple projects within a corridor, network, or region, and possibly across agency jurisdictions to minimize work zone traffic impacts
Project Coordination – Example #1 Software-based systems used to coordinate right-of-way construction activities Project coordination software used to track capital and maintenance activities Baltimore, MD • Real-time information across city • Accessible to all stakeholders • Earlier awareness of project conflicts/impacts and enhanced Traffic Management Plans Online mapping system to improve coordination among utility companies, contractors and transportation agencies New York, NY • Share scheduled work and long-term capital plans • Minimizes times streets dug up, reduces congestion and extends life of resurfaced roads
Project Coordination – Example #2 Corridor-level Traffic Management Plans (TMP) used to address work zone impacts (Oregon) • Oregon going through significant construction period • Three levels of TMP used for corridor management and related mobility impacts • Corridor-Level TMPs • Assess corridor traffic impacts • Define corridor/segment delay thresholds • Suggest traffic mgmt. strategies • Discuss implementation plan Source: Oregon DOT
Project Coordination – Example #3 Construction Traffic Management (WSDOT) • Collaborative, multi-agency construction traffic planning effort • Long-term, mid-term, and short-term information sharing • Construction Impact Analysis Tool, Maps, Gantt Charts • Hot Spots, Watch Lists Source: WSDOT
Project Coordination – Example #4 Work Zone Implementation Strategies Estimator (WISE) WISE Planning Module WISE Operations Module • Optimized sequencing of renewal projects • DynusT platform that evaluates the impact of individual strategies at the project level • SHRP2 R11 Project: Strategic Approaches at the Corridor and Network Levels to Minimize Disruption from the Renewal Process WISE Proactively reduces work zone impacts with: • Effective project coordination upfront in planning/ programming • Carryingcoordination through to project planning/design decisions
Project Coordination – Example #4 (cont.) Work Zone Implementation Strategies Estimator (WISE) • Helps bridge the gap between planning/MPOs and design-construction/DOTs • Has ability to analyze demand and duration based strategies • Supports better and more complex decision-making • Current Status: • Testing of WISE tool is complete • Field validation testing (2 sites) • Pilot testing (2 sites) • Tool and related documentation is available • Assessing readiness for implementation (in process)
Project Coordination – Example #4 (cont.) Work Zone Implementation Strategies Estimator (WISE)
Smarter Work Zonesproject coordination:case study Michigan DOT I-94 Corridor
Project Coordination – Barriers and Challenges • Lack of coordination and differences in priorities • Inter/intra-agency • Public/private • Lack of incentives/motivation for coordination/fear of failure • Resistance to change (cultural, procedural, technical) • Constrained resources Source: matoc.org
I-94 Corridor Case Study – Overview • I-94 Corridor Operations Partnership (COP) • Performance Measures • Technology, Resources, Data • Communication • Lessons Learned • Best Practices
I-94 Corridor Case Study – Partnerships I-94 Fast Facts • 3Regions • 9Transportation Service Centers • 9 Counties • 275 miles
I-94 Corridor Case Study – Partnerships (cont.) • I-94 Corridor Operation Partnership (COP) Mission: “Improve traffic operations and system reliability along the I‐94 corridor statewide.” I-94 COP Objectives • Unification of the I-94 corridor with one focus • Travel Reliability: 40 min delay max for entire corridor
I-94 Corridor Case Study – User Delay Cost Breakdown Recurring vs. Non-Recurring Delay • Recurring congestion is the baseline. • Non-recurring are above the baseline; examples, winter, work zones and traffic incidents. Breakdown is based on three year average provided by RITIS.
I-94 Corridor Case Study – Cost Performance Measures Cost Performance Measure • Limit the 2013 user delay cost (UDC) on the I-94 corridor to $108 million. Year to Date UDC vs Goal Weekly UDC vs Goal Weekly UDC vs Goal UDC Weekly Summary
I-94 Corridor Case Study – Time Performance Measures Travel Time Delay • Maintain a maximum of 40 minutes travel time delay for the I-94 corridor Travel Time Results by Segment
I-94 Corridor Case Study – Resources, Technology and Data • Operation focus shift • ITS infrastructure • Vehicle speed probe data • Manual calculation of delay • Auto calculation of delay Regional Integrated Transportation Information System (RITIS)
I-94 Corridor Case Study – Communication Performance Measures • This measure targets: • Communication between operations and construction • Incorporate maintenance, permits, construction work zones each week Communication Performance Measure • Perform maintenance of traffic huddles (MOTH) for 90% of weeks with active work zones.
I-94 Corridor Case Study – Statewide Communication • Process requires full support from top management. • Support for the added time and effort for coordination • Change from a construction based approach to operations view
I-94 Corridor Case Study – Lessons Learned • Change in behavior/culture • Project development is key to success • Applying experience helped us to refine lane restrictions and work operations • Testing cultural change to measure communication Mission: Improve traffic operations and system reliability along the I-94 corridor statewide
I-94 Corridor Case Study – Best Practices • Region work zone Gantt Chart • Incorporation of maintenance activities • I-94 Jackson – Freeway closure example • Project level delay mitigation • Towing incentives • Off peak work based on delay measures • Increase in the use of incentive/disincentive • Incorporation of new ITS infrastructure
Project Coordination – Benefits • Greater ability to reduce and manage traffic disruptions from road work • Earlier identification of project impacts • Fewer number of work zones • Dynamic adjustments to project schedule
Project Coordination – Benefits cont. • Improved communications within and across agencies • Reduced numbers of street cuts • Better quality road surfaces • Cost savings • Increased customer satisfaction
For Additional information:chris brookes I-94 Corridor Case Study • Work Zone Delivery Engineer (Michigan DOT) • BrookesC@michigan.gov
Project Coordination - Goals By December 2016, 20 State DOTs have incorporated work zone project coordination strategies into agency documentation and business processes for improving safety and reducing work zone delays By December 2016, five State DOTs have volunteered to pilot the WISE (Work Zone Impact & Strategy Estimator) software application. Source: TRB
Project Coordination - Resources • FHWA • FHWA Every Day Counts Website http://www.fhwa.dot.gov/everydaycounts/ • FHWA Work Zone Mobility and Safety Program – Project Coordination http://www.ops.fhwa.dot.gov/wz/construction/crp/index.htm • FHWA Work Zone Mobility and Safety Program – Peer-to-Peer Program http://www.ops.fhwa.dot.gov/wz/p2p/index.htm • FHWA Work Zone ITS Implementation Guide http://ops.fhwa.dot.gov/publications/fhwahop14008/fhwahop14008.pdf • TRB SHRP2 • WISE Software Users Guide http://onlinepubs.trb.org/onlinepubs/shrp2/SHRP2_S2-R11-RW-2.pdf • NCHRP • NCHRP Synthesis 413: Techniques for Effective Highway Construction Projects in Congested Urban Areas http://onlinepubs.trb.org/onlinepubs/nchrp/nchrp_syn_413.pdf • Others • Highway Construction Coordination to Minimize Traffic Impacts http://planning.transportation.org/Documents/8-36/NCHRP8-36(56)FinalReport.pdf
Technology Application – What is it? Deployment of Intelligent Transportation Systems (ITS) for dynamic management of work zone traffic impacts, such as queue and speed management.
Technology Application – Why bother? Source: http://thesouthern.com/news/local/article_d2ba9b7a-9090-11df-b22a-001cc4c002e0.html?mode=image
Technology Application – Basic Criteria Work Zone Technology Applications: • Are traffic responsive – incorporate real-time data collection • Provide enhanced information delivery to drivers • Increase awareness of changes to traffic conditions arising from construction activity • Enhance compliance with static traffic controls • Facilitate improved decision-making by drivers approaching work zones • Functions are automated and dynamic • Complement static traffic controls • Information delivery does not require special action on the part of drivers
Technology Application – Basic Criteria • Locally focused • System solution • May arise from maturation of agency practices using existing hardware • Includes off-the-shelf systems as well as systems developed to agency specifications
Technology Application Example: Queue Warning System (QWS) Zone of advanced work zone awareness provided by Queue Warning System Warning Signs installed per TCP Work Zone data Queue Warning Controller STOPPED TRAFFIC 2 MILES Queue Detection Zone DYNAMIC WARNING MESSAGE PCMS
Technology Application Example: Variable Speed Limits (VSL) • Multiple speed trailers in & approaching work zone • Each unit monitors prevailing speed – relays information to upstream units. • Posted speed limit dynamically adjusted to reduce downstream speed differential http://www.michigan.gov/documents/mdot/MDOT_Research_Report_RC1467_200924_7.pdf
Technology Application Example: Work Zone Access / Egress warning Source: Texas Transportation Institute Guidelines on Improving Work Zone Safety throughPublic Information and Traveler Information http://www.workzonesafety.org/research/record/10859
Technology Application Example: Dynamic Lane Merge Early Merge In low-volume conditions reduces the occurrence of high-speed merging at the point of lane closure. Late Merge In high-volume conditions reduces the length of the queue. Source: Maryland State Highway Administration