Download
1 / 1
10 likes | 143 Vues
Verification of Thunderstorm Occurrence Using the National Lightning Detection Network Kristen L. Corbosiero and Ross A. Lazear University at Albany, State University of New York. Introduction and Motivation.

E N D
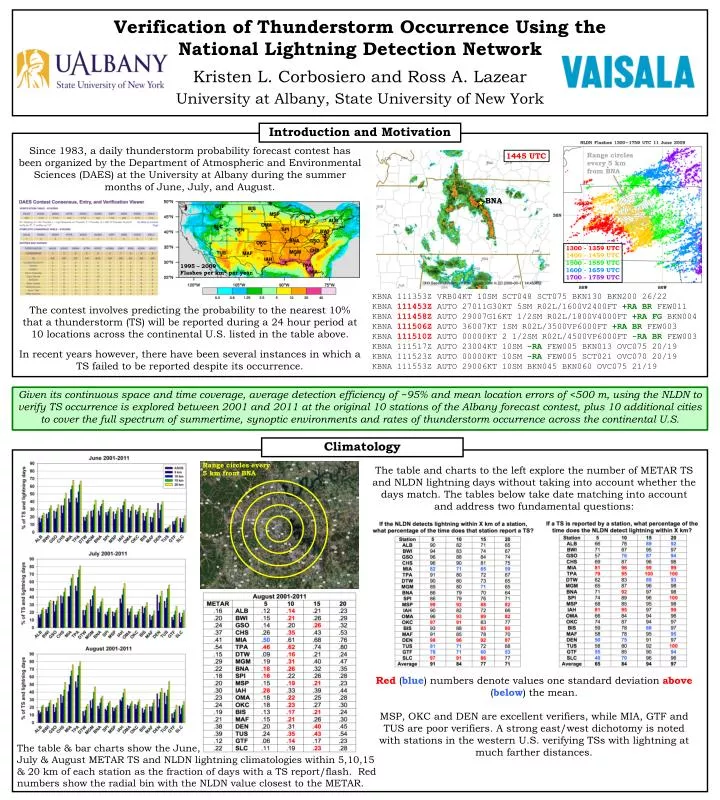
Verification of Thunderstorm Occurrence Using the National Lightning Detection Network Kristen L. Corbosiero and Ross A. Lazear University at Albany, State University of New York Introduction and Motivation Since 1983, a daily thunderstorm probability forecast contest has been organized by the Department of Atmospheric and Environmental Sciences (DAES) at the University at Albany during the summer months of June, July, and August. The contest involves predicting the probability to the nearest 10% that athunderstorm (TS) will be reported during a 24 hour period at 10 locations across the continental U.S. listed in the table above. In recent years however, there have beenseveral instances in which a TS failed to bereported despite its occurrence. Range circles every 5 km from BNA 1445 UTC BNA 1300 - 1359 UTC 1400 - 1459 UTC 1500 - 1559 UTC 1600 - 1659 UTC 1700 - 1759 UTC 1995 – 2009 Flashes per km2 per year KBNA 111353Z VRB04KT 10SM SCT048 SCT075 BKN130 BKN200 26/22 KBNA 111453Z AUTO 27011G30KT 5SM R02L/1600V2400FT +RA BR FEW011 KBNA 111458Z AUTO 29007G16KT 1/2SM R02L/1800V4000FT +RA FG BKN004 KBNA 111506Z AUTO 36007KT 1SM R02L/3500VP6000FT +RA BR FEW003 KBNA 111510Z AUTO 00000KT 2 1/2SM R02L/4500VP6000FT -RA BR FEW003 KBNA 111517Z AUTO 23004KT 10SM -RA FEW005 BKN013 OVC075 20/19 KBNA 111523Z AUTO 00000KT 10SM -RA FEW005 SCT021 OVC070 20/19 KBNA 111553Z AUTO 29006KT 10SM BKN045 BKN060 OVC075 21/19 Given its continuous space and time coverage, average detection efficiency of ~95% and mean location errors of <500 m, using the NLDN to verify TS occurrence isexplored between 2001 and 2011 at the original 10 stations of the Albany forecast contest, plus 10 additional cities to cover the full spectrum of summertime, synoptic environments and rates of thunderstorm occurrence across the continental U.S. Climatology Range circles every5 km from BNA The table and charts to the left explore the number of METAR TS and NLDN lightning days without taking into account whether the days match. The tables below take date matching into account and address two fundamental questions: Red(blue) numbers denote values one standard deviation above (below) the mean. MSP, OKC and DEN are excellent verifiers, while MIA, GTF and TUS are poor verifiers. A strong east/west dichotomy is noted with stations in the western U.S. verifying TSs with lightning at much farther distances. a a o The table & bar charts show the June,July & August METAR TS and NLDN lightning climatologies within 5,10,15 & 20 km of each station as the fraction of days with a TS report/flash. Red numbers show the radial bin with the NLDN value closest to the METAR.