Download
1 / 29
290 likes | 402 Vues
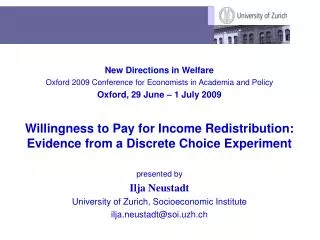
OECD Universities’ Joint Economics Congress Paris, 6-8 July 2011 New Directions in Welfare II “Measuring Patterns of Local Human and Sustainable Development” Mario Biggeri and Vincenzo Mauro Department of Economics, University of Florence Contact vincenzo.mauro@unifi.it

E N D
OECD Universities’ Joint Economics Congress Paris, 6-8 July 2011 New Directions in Welfare II “Measuring Patterns of Local Human and Sustainable Development” Mario Biggeri and Vincenzo Mauro Department of Economics, University of Florence Contact vincenzo.mauro@unifi.it WORK IN PROGRESS! COMMENTS WELCOME.
- Theoretical approach to analyse local development from a human sustainable development angle • A method to examine human development from a multidimensional and time perspective • Preliminary results of the research
Starting point “The separation of the ‘economic’ from the ‘social’ discourse is inherent in the leader–follower hierarchy model of the orthodox policy recommendations. … In such circumstances, Social Funds and education and health ministries are left to take care of the consequences of macroeconomic policy mistakes – essentially, to pick up the pieces.” (Mehrotra and Delamonica, 2007, p. 14).
Theoretical approaches to development and to local development Indeed, most of the theoretical frameworks analyse development at local level focussing separately on the economic or social aspects, rather than jointly. We conceptually underline the need to integrate environmental and social-sector policies with economic ones at local level.
The two synergies The idea is based on the existence of synergies in policy implementation between social and economic outcomes (see for instance Mehrotra and Delamonica 2007, and Mehrotra and Biggeri, 2007). (The idea was conceived initially by Mehrotra and Jolly, 1997 and Taylor et al, 1997)
The two synergies (both at individual level) The first synergy is between interventions within basic social services (BSS). Interventions in health, nutrition, water and sanitation, environment, fertility control and education complement each other. This increases the impact of any one from investments in any other. The second synergy is between economic opportunities (e.g. income increase) and social and education opportunities
HSD at local level In this work we are especially interested in the second synergy. We therefore consider: - The social-environmental dimension SD (This should be the result at aggregate local level of different components of the first synergy above mentioned) - The economic dimension ED. This should be the results at aggregate level of different components which determine the economic opportunity/efficiency at local level
Possible routes of a unit (i.e. a local cluster over time) toward Human Sustainable Development HSD
Possible routes of a unit (i.e. a local cluster over time) toward Human Sustainable Development HSD
Possible routes of a unit (i.e. a local cluster over time) toward efficiency
Idea: Represent the units on the figure below, and try to observe their shift over time Need for two indexes or a bi-dimensional index that can describe both situations
Many approaches are possible to describe both social and economic components: most of them have to face a step where the variables available are aggregated into a (possibly single) value.
Possible approach: use a function (e.g. a distance from an “optimal” point) to reduce the dimensionality Unit A (economic) Unit A (social)
Possible approach: use a function (e.g. a distance from an “optimal” point) to reduce the dimensionality Unit B (social) Unit B (economic)
Why a distance from a “best” unit? Because it underlines the effect of the synergy A B
Why a distance from a “best” unit? Because it underlines the effect of the synergy Linear: perfect substitutability
Why a distance from a “best” unit? Because it allows to overcome the problem of the implicit weighting depending on the variability of the distribution of every single dimension A B
…and a single unit is observable over time. 1998 2006 2010 2002
Characteristics of analysis • Dynamic: medium-term analysis with 4-years intervals • Multidimensional: economic and social dimensions with 5 subdimensions each
Medium-term analysis • 1998 • 2002 • 2006 • 2010 (or most recent data) 4-years intervals are needed to observe significant movements on Local Human Development trajectories
Main difficulties in data collection • Missing data in panel series • Some indicators changed over time • Low territorial disaggregation (province level)
Mc Pt Lu Po Tuscany is divided into 10 provinces Fi Pi Ar Approx. 3.7M inhabitants Si Li Gr
Some Results (1) EconomicDimension Social Dimension
Some Results (2) EconomicDimension Social Dimension
Interpretation of preliminary results • Most units follow route quite close to a synergic pattern • Similar trajectory 1998-2002 except for Livorno and Massa-Carrara (decline ED) • Impressive impact of recent financial crisis: dramatic decline in SD in all provinces • ED seems to diminish sensitively its growth rate
Thank you ! (Comments/questions?)