Download
1 / 26
260 likes | 609 Vues
A Comparative Usability Evaluation of User Interfaces for Online Product Catalogs. Ewa Callahan Jürgen Koenemann Presented by: Xiaohong Bao. Introduction. A comparative study of the usability of hierarchical structure and Infozoom

E N D
A Comparative Usability Evaluation of User Interfaces for Online Product Catalogs Ewa Callahan Jürgen Koenemann Presented by: Xiaohong Bao ICS280 Information Visualization
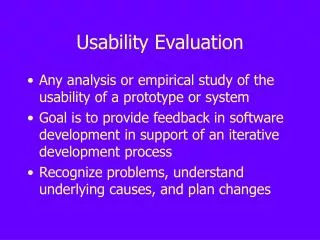
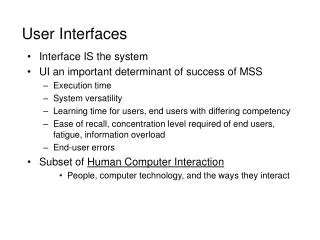
Introduction • A comparative study of the usability of hierarchical structure and Infozoom • The increase in electronic commerce creates a need for Electronic Product Catalogs (EPC). • Navigation problems are the second most cited reason for not shopping online. ICS280 Information Visualization
Introduction ---cont’d • The most common catalog interfaces on the web are hierarchically organized catalogs. • Problems: • Confusing • Items in dropdown menus are not visible • Lengthy result pages force users to scroll • Solutions: • Recommendation approach • Interaction approach ICS280 Information Visualization
Evaluation of existing online catalogs List of Websites Evaluated (Fall 1999) 1. www.autobytel.com 2. www.Auto.de 3. www.autoinfo.de 4. Automarkt 5. www.auto-shop.de 6. www.autosite.com 7. www.autotaal.nl 8. carpoint.msn.com 9. www.dadb.com 10. www.faircar.de 11. Lycos Decision Guide Cars 12. Mastercar.de 13. www.mobile.de 14. www.whatcar.co.uk ICS280 Information Visualization
Evaluation results ICS280 Information Visualization
Result analysis • Database size • Searching mode • Attribute • Specifying ranges • Searching history • Result pages • Sorting search results • Item comparison ICS280 Information Visualization
Infozoom introduction • Based on dynamic queries and fisheye techniques • Attributes as rows and objects as columns • Compressed mode and overview mode • Many ways of searching • Easy to compare, sort and re-order the results ICS280 Information Visualization
Overview Mode ICS280 Information Visualization
Compressed mode ICS280 Information Visualization
Usability study • From the feature comparison of Infozoom and the hierarchical interface, Infozoom should be more efficient • A comparative usability study to confirm it ICS280 Information Visualization
Materials • A database contains 1690 cars with over 20 attributes. • The hierarchical interface was implemented with forms in MS Access. ICS280 Information Visualization
Hierarchical interface-1 ICS280 Information Visualization
Hierarchical interface-2 ICS280 Information Visualization
Hierarchical interface-3 ICS280 Information Visualization
Participants • Totally 26 participants • 15 male and 11 female • 13 aged 21~30; 9 aged 31~40; one teenager and one over 51 • 16 use computers over 10h/week; 6 3~9 h/week; 4 less than 2h/week ICS280 Information Visualization
Tasks • Find Attribute value for given Object T1: Does the Jaguar XJR have side airbags? • Find Database SubSet Attribute Value T2: How many different models does the Peugeot class 106 have? T4: How many cars have the following characteristics: convertible, 100-150 HP, front drive, and cost 40.000 DM or less? • For given Attribute(s) value(s) Find Object(s) T3: Which middle class car is the cheapest one in the database? T6: Which Funcar has the quickest acceleration? ICS280 Information Visualization
Tasks-cont’d • Compare Attribute Values for 2 Objects T5: Which car has better fuel consumption: the Audi A6 1.8 or the Volvo S70 2.0? • Find Database Attribute Value T7: How many cars are in this catalog? • Compare Attribute Values for Subset T8: What is the price range (from the cheapest to the most expensive model) for the Alfa Romeo 145 series? T9: Is the acceleration of the Mercedes-Benz S430 Automatic slow, normal, or quick for a car of its class? ICS280 Information Visualization
Procedure • Introduce the purpose and upcoming tasks briefly • 5 minutes demo about Infozoom • Introduce 9 tasks. After each task, they answer 3 questions about the satisfaction, perception of the time needed, perceived efficiency • Summarizing their experience ICS280 Information Visualization
Results • Accuracy • Completion time AVGIZ = 19.4 min / AVGHI = 27.7 min • Navigation Ease of use: IZ 5.5 / HI 4.9 over 7 Efficiency: IZ 5.0 / HI 4.8 • Satisfaction Comfortable: IZ 5.15 / HI 5.23 Fun: IZ 6.3 / HI 5.0 Overall satisfaction: IZ 6.38 / HI 5.38 ICS280 Information Visualization
Completion rate and accuracy ICS280 Information Visualization
Observations • Users’ strategies • Critical incidents --- breakdown and things that went especially well • Users’ comments ICS280 Information Visualization
Hierarchical interface • Dislike look for desired information from main menu • Be lost on pages that looked like • Be annoyed by the long pull-down menus and lengthy result pages • Be confused about the default values and attributes visible • Be inpatient about no car matched ICS280 Information Visualization
Infozoom Interface • Feel overload at the first glance • Hard to choose appropriate search strategy at the beginning • Difficult to double-click on the small sectors if selecting objects on the screen ICS280 Information Visualization
Conclusion • Both EPC’s interfaces were rated highly, but Infozoom was rated higher in overall performance • Infozoom supports choice by attribute searching strategy better • Infozoom interface has easy learnability ICS280 Information Visualization