Download
1 / 17
180 likes | 782 Vues
Understanding data and Introduction to SPSS. Useful tips. It is not possible to show all types of statistical analysis for even one package You will want to look at recent texts Using clinical examples in learning

E N D
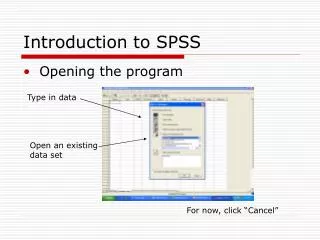
Useful tips • It is not possible to show all types of statistical analysis for even one package • You will want to look at recent texts • Using clinical examples in learning • More focus will be on producing the right analysis and how to interpret results • You cannot do anything until you have entered the data
SPSS • Statistical Package for Social Sciences • Input data once • You only need to know the tests you want to conduct, not how to compute them • The software should not make errors in calculation • New data, new input, data would be corrected • Recalculations • Inappropriate test used • Many different approaches needed on data
Data and data entry • Use spread sheets • Rows are subjects and columns are variables • Variable view: make sure about the coding of variables and levels of measurement • Manual Check: Nothing can replace another pair of eyes to check over a data set. Either check your data entry, input & manipulation yourself, or get somebody else to do it. The more important the data, the more careful the check.
Univariate Analyses Helpful in: • cleaning & checking data quality • examining data variability • describing the sample • checking statistical assumptions prior to performing more complex analyses
Presenting Data • Table • Condenses data into a form that can make them easier to understand; • Shows many details in summary fashion; BUT • Since table shows only numbers, it may not be readily understood without comparing it to other values.
Principles of Table Construction • Don’t try to do too much in a table • Use white space effectively to make table layout pleasing to the eye. • Make sure tables & test refer to each other. • Use some aspect of the table to order & group rows & columns.
Principles of Table Construction • If appropriate, frame table with summary statistics in rows & columns to provide a standard of comparison. • Round numbers in table to one or two decimal places to make them easily understood. • When creating tables for publication in a manuscript, double-space them unless contraindicated by journal.
Presenting Data Chart - Visual representation of a frequency distribution that helps to gain insight about what the data mean. - Built with lines, area & text: bar charts Ex: bar chart, pie chart
Bar Chart • Simplest form of chart • Used to display nominal or ordinal data
Pie Chart • Alternative to bar chart • Circle partitioned into percentage distributions of qualitative variables with total area of 100%
Histogram • Appropriate for interval, ratio and sometimes ordinal data • Similar to bar charts but bars are placed side by side • Often used to represent both frequencies and percentages • Most histograms have from 5 to 20 bars
Polygon Patients’ Wait for Chest X-Ray Minutes
Hallmarks of a Good Chart • Simple & easy to read • Placed correctly within text • Use color only when it has a purpose, not solely for decoration • Make sure others can understand chart; try it out on somebody first • Remember: A poor chart is worse than no chart at all.