Download
1 / 1
10 likes | 131 Vues
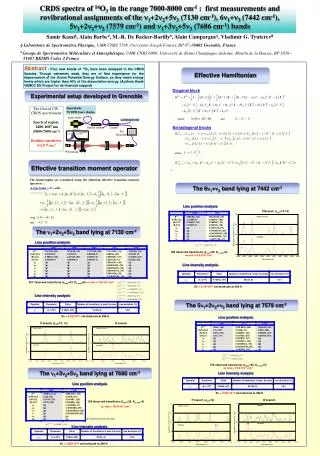
threshold. Laser OFF. 100. -50. 0. 50. Effective Hamiltonian. Experimental setup developed in Grenoble. The 5 n 1 +2 n 2 + n 3 band lying at 7579 cm -1. The n 1 +2 n 2 +5 n 3 band lying at 7130 cm -1. The n 1 +3 n 2 +5 n 3 band lying at 7686 cm -1.

E N D
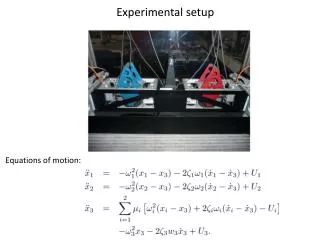
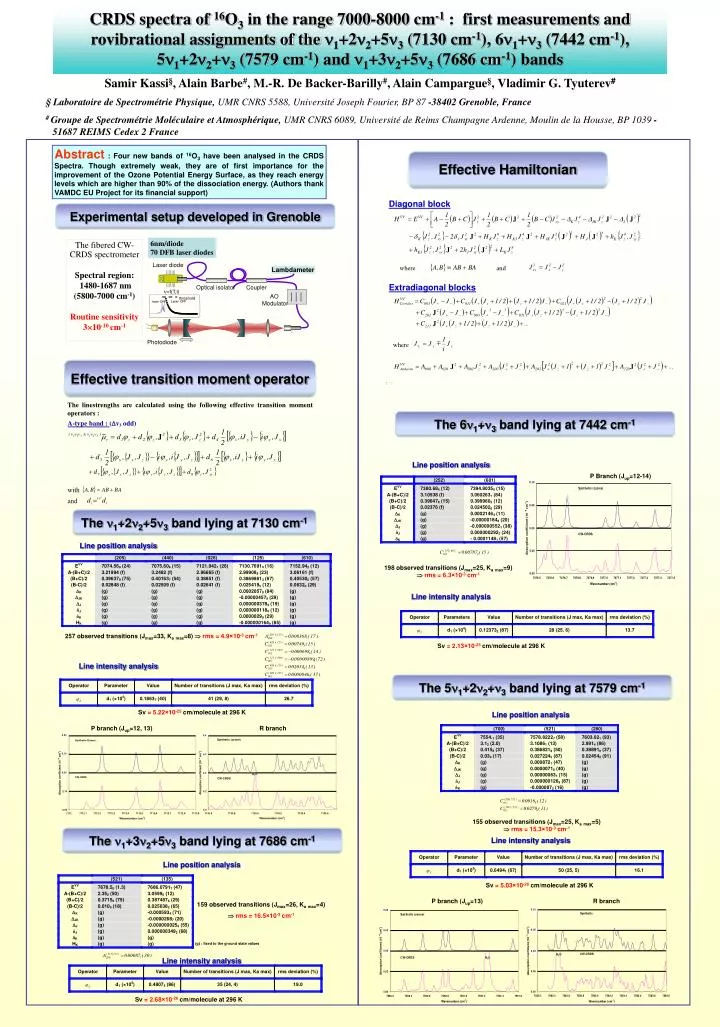
threshold Laser OFF 100 -50 0 50 Effective Hamiltonian Experimental setup developed in Grenoble The 5n1+2n2+n3 band lying at 7579 cm-1 The n1+2n2+5n3 band lying at 7130 cm-1 The n1+3n2+5n3 band lying at 7686 cm-1 The 6n1+n3 band lying at 7442 cm-1 6nm/diode 70 DFB laser diodes The fibered CW-CRDS spectrometer Spectral region: 1480-1687 nm (5800-7000 cm-1) Routine sensitivity 310-10 cm-1 Laser diode Lambdameter Optical isolator Coupler n=f(T,I) AO Modulator laser ON Diagonal block Photodiode Extradiagonal blocks The linestrengths are calculated using the following effective transition moment operators : Effective transition moment operator CRDS spectra of 16O3 in the range 7000-8000 cm-1 : first measurements and rovibrational assignments of the n1+2n2+5n3 (7130 cm-1), 6n1+n3 (7442 cm-1), 5n1+2n2+n3 (7579 cm-1) and n1+3n2+5n3 (7686 cm-1) bands Samir Kassi§, Alain Barbe#, M.-R. De Backer-Barilly#, Alain Campargue§, Vladimir G. Tyuterev# § Laboratoire de Spectrométrie Physique, UMR CNRS 5588, Université Joseph Fourier, BP 87 -38402 Grenoble, France # Groupe de Spectrométrie Moléculaire et Atmosphérique, UMR CNRS 6089, Université de Reims Champagne Ardenne, Moulin de la Housse, BP 1039 - 51687 REIMSCedex 2 France Abstract : Four new bands of 16O3 have been analysed in the CRDS Spectra. Though extremely weak, they are of first importance for the improvement of the Ozone Potential Energy Surface, as they reach energy levels which are higher than 90% of the dissociation energy.(Authors thank VAMDC EU Project for its financial support) Line position analysis P Branch (Jup=12-14) Line position analysis 198 observed transitions (Jmax=25, Kamax=9) rms = 6.3×10⁻³ cm-1 Line intensity analysis 257 observed transitions (Jmax=33, Kamax=8) rms = 4.9×10⁻³ cm-1 Sv = 2.13×10⁻²⁵cm/molecule at 296 K Line intensity analysis Sv = 5.22×10⁻²⁵cm/molecule at 296 K Line position analysis P branch (Jup=12, 13) R branch 155 observed transitions (Jmax=25, Kamax=5) rms = 15.3×10⁻³ cm-1 Line intensity analysis Line position analysis Sv = 5.03×10⁻²⁶cm/molecule at 296 K P branch (Jup=13) R branch 159 observed transitions (Jmax=26, Kamax=4) rms = 16.5×10⁻³ cm-1 (g) : fixed to the ground state values Line intensity analysis Sv = 2.68×10⁻²⁶cm/molecule at 296 K