Download
1 / 59
590 likes | 692 Vues
V21 Metabolic Pathway Analysis (MPA).

E N D
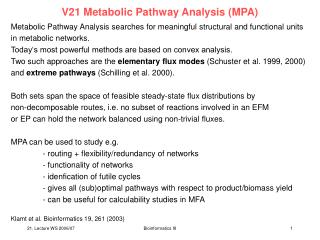
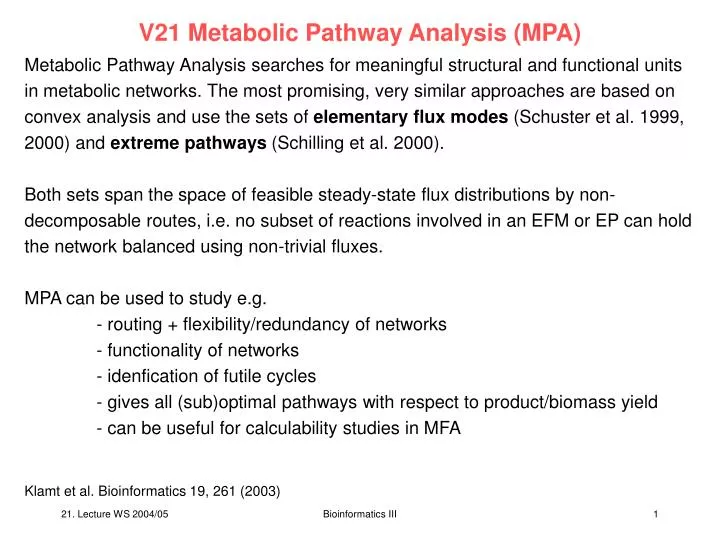
V21 Metabolic Pathway Analysis (MPA) Metabolic Pathway Analysis searches for meaningful structural and functional units in metabolic networks. The most promising, very similar approaches are based on convex analysis and use the sets of elementary flux modes (Schuster et al. 1999, 2000) and extreme pathways (Schilling et al. 2000). Both sets span the space of feasible steady-state flux distributions by non-decomposable routes, i.e. no subset of reactions involved in an EFM or EP can hold the network balanced using non-trivial fluxes. MPA can be used to study e.g. - routing + flexibility/redundancy of networks - functionality of networks - idenfication of futile cycles - gives all (sub)optimal pathways with respect to product/biomass yield - can be useful for calculability studies in MFA Klamt et al. Bioinformatics 19, 261 (2003) Bioinformatics III
Metabolic Pathway Analysis: Elementary Flux Modes The technique of Elementary Flux Modes (EFM) was developed prior to extreme pathways (EP) by Stephan Schuster, Thomas Dandekar and co-workers: Pfeiffer et al. Bioinformatics, 15, 251 (1999) Schuster et al. Nature Biotech. 18, 326 (2000) The method is very similar to the „extreme pathway“ method to construct a basis for metabolic flux states based on methods from convex algebra. Extreme pathways are a subset of elementary modes, and for many systems, both methods coincide. Are the subtle differences important? Bioinformatics III
Elementary Flux Modes Start from list of reaction equations and a declaration of reversible and irreversible reactions and of internal and external metabolites. E.g. reaction scheme of monosaccharide Fig.1 metabolism. It includes 15 internal metabolites, and 19 reactions. S has dimension 15 19. It is convenient to reduce this matrix by lumping those reactions that necessarily operate together. {Gap,Pgk,Gpm,Eno,Pyk}, {Zwf,Pgl,Gnd} Such groups of enzymes can be detected automatically. This reveals another two sequences {Fba,TpiA} and {2 Rpe,TktI,Tal,TktII}. Schuster et al. Nature Biotech 18, 326 (2000) Bioinformatics III
Elementary Flux Modes Lumping the reactions in any one sequence gives the following reduced system: Construct initial tableau by combining S with identity matrix: Ru5P FP2 F6P GAP R5P Pgi {Fba,TpiA} Rpi reversible {2Rpe,TktI,Tal,TktII} {Gap,Pgk,Gpm,Eno,Pyk} {Zwf,Pgl,Gnd} Pfk irreversible Fbp Prs_DeoB T(0)= Schuster et al. Nature Biotech 18, 326 (2000) Bioinformatics III
Elementary Flux Modes Aim again: bring all entries of right part of matrix to 0. E.g. 2*row3 - row4 gives „reversible“ row with 0 in column 10 New „irreversible“ rows with 0 entry in column 10 by row3 + row6 and by row4 + row7. In general, linear combinations of 2 rows corresponding to the same type of directio- nality go into the part of the respective type in the tableau. Combinations by different types go into the „irreversible“ tableau because at least 1 reaction is irreversible. Irreversible reactions can only combined using positive coefficients. T(0)= T(1)= Schuster et al. Nature Biotech 18, 326 (2000) Bioinformatics III
Elementary Flux Modes Aim: zero column 11. Include all possible (direction-wise allowed) linear combinations of rows. continue with columns 12-14. T(1)= T(2)= Schuster et al. Nature Biotech 18, 326 (2000) Bioinformatics III
Elementary Flux Modes In the course of the algorithm, one must avoid - calculation of nonelementary modes (rows that contain fewer zeros than the row already present) - duplicate modes (a pair of rows is only combined if it fulfills the condition S(mi(j)) S(mk(j)) S(ml(j+1)) where S(ml(j+1)) is the set of positions of 0 in this row. - flux modes violating the sign restriction for the irreversible reactions. Final tableau T(5) = This shows that the number of rows may decrease or increase in the course of the algorithm. All constructed elementary modes are irreversible. Schuster et al. Nature Biotech 18, 326 (2000) Bioinformatics III
Elementary Flux Modes Graphical representation of the elementary flux modes of the monosaccharide metabolism. The numbers indicate the relative flux carried by the enzymes. Fig. 2 Schuster et al. Nature Biotech 18, 326 (2000) Bioinformatics III
Two approaches for Metabolic Pathway Analysis? The pathway P(v) is an elementary flux mode if it fulfills conditions C1 – C3. (C1) Pseudo steady-state. S e = 0. This ensures that none of the metabolites is consumed or produced in the overall stoichiometry. (C2) Feasibility: rate ei 0 if reaction is irreversible. This demands that only thermodynamically realizable fluxes are contained in e. (C3) Non-decomposability: there is no vector v (unequal to the zero vector and to e) fulfilling C1 and C2 and that P(v) is a proper subset of P(e). This is the core characteristics for EFMs and EPs and supplies the decomposition of the network into smallest units (able to hold the network in steady state). C3 is often called „genetic independence“ because it implies that the enzymes in one EFM or EP are not a subset of the enzymes from another EFM or EP. Klamt & Stelling Trends Biotech 21, 64 (2003) Bioinformatics III
Two approaches for Metabolic Pathway Analysis? The pathway P(e) is an extreme pathway if it fulfills conditions C1 – C3 AND conditions C4 – C5. (C4) Network reconfiguration: Each reaction must be classified either as exchange flux or as internal reaction. All reversible internal reactions must be split up into two separate, irreversible reactions (forward and backward reaction). (C5) Systemic independence: the set of EPs in a network is the minimal set of EFMs that can describe all feasible steady-state flux distributions. Klamt & Stelling Trends Biotech 21, 64 (2003) Bioinformatics III
Two approaches for Metabolic Pathway Analysis? A(ext) B(ext) C(ext) R1 R2 R3 R4 B R8 R7 R5 A C P R9 R6 D Klamt & Stelling Trends Biotech 21, 64 (2003) Bioinformatics III
Reconfigured Network A(ext) B(ext) C(ext) R1 R2 R3 R4 B R8 R7f R7b A C P R5 R9 R6 D 3 EFMs are not systemically independent: EFM1 = EP4 + EP5 EFM2 = EP3 + EP5 EFM4 = EP2 + EP3 Klamt & Stelling Trends Biotech 21, 64 (2003) Bioinformatics III
Property 1 of EFMs The only difference in the set of EFMs emerging upon reconfiguration consists in the two-cycles that result from splitting up reversible reactions. However, two-cycles are not considered as meaningful pathways. Valid for any network: Property 1 Reconfiguring a network by splitting up reversible reactions leads to the same set of meaningful EFMs. Klamt & Stelling Trends Biotech 21, 64 (2003) Bioinformatics III
Software: FluxAnalyzer What is the consequence of when all exchange fluxes (and hence all reactions in the network) are irreversible? EFMs and EPs always co-incide! Klamt & Stelling Trends Biotech 21, 64 (2003) Bioinformatics III
Property 2 of EFMs Property 2 If all exchange reactions in a network are irreversible then the sets of meaningful EFMs (both in the original and in the reconfigured network) and EPs coincide. Klamt & Stelling Trends Biotech 21, 64 (2003) Bioinformatics III
Reconfigured Network A(ext) B(ext) C(ext) R1 R2 R3 R4 B R8 R7f R7b A C P R5 R9 R6 D 3 EFMs are not systemically independent: EFM1 = EP4 + EP5 EFM2 = EP3 + EP5 EFM4 = EP2 + EP3 Klamt & Stelling Trends Biotech 21, 64 (2003) Bioinformatics III
Comparison of EFMs and EPs Problem EFM (network N1) EP (network N2) Recognition of 4 genetically indepen- Set of EPs does not contain operational modes: dent routes all genetically independent routes for converting (EFM1-EFM4) routes. Searching for EPs exclusively A to P. leading from A to P via B, no pathway would be found. Klamt & Stelling Trends Biotech 21, 64 (2003) Bioinformatics III
Comparison of EFMs and EPs Problem EFM (network N1) EP (network N2) Finding all the EFM1 and EFM2 are One would only find the optimal routes: optimal because they suboptimal EP1, not the optimal pathways for yield one mole P per optimal routes EFM1 and synthesizing P during mole substrate A EFM2. growth on A alone. (i.e. R3/R1 = 1), whereas EFM3 and EFM4 are only sub- optimal (R3/R1 = 0.5). Klamt & Stelling Trends Biotech 21, 64 (2003) Bioinformatics III
Comparison of EFMs and EPs Problem Analysis of network flexibility (structural robustness, redundancy): relative robustness of exclusive growth on A or B. EFM (network N1) 4 pathways convert A to P (EFM1-EFM4), whereas for B only one route (EFM8) exists. When one of the internal reactions (R4-R9) fails, for production of P from A 2 pathways will always „survive“. By contrast, removing reaction R8 already stops the production of P from B alone. EP (network N2) Only 1 EP exists for producing P by substrate A alone, and 1 EP for synthesizing P by (only) substrate B. One might suggest that both substrates possess the same redundancy of pathways, but as shown by EFM analysis, growth on substrate A is much more flexible than on B. Klamt & Stelling Trends Biotech 21, 64 (2003) Bioinformatics III
Comparison of EFMs and EPs Problem Relative importance of single reactions: relative importance of reaction R8. EFM (network N1) R8 is essential for producing P by substrate B, whereas for A there is no structurally „favored“ reaction (R4-R9 all occur twice in EFM1-EFM4). However, considering the optimal modes EFM1, EFM2, one recognizes the importance of R8 also for growth on A. EP (network N2) Consider again biosynthesis of P from substrate A (EP1 only). Because R8 is not involved in EP1 one might think that this reaction is not important for synthesizing P from A. However, without this reaction, it is impossible to obtain optimal yields (1 P per A; EFM1 and EFM2). Klamt & Stelling Trends Biotech 21, 64 (2003) Bioinformatics III
Comparison of EFMs and EPs Problem Enzyme subsets and excluding reaction pairs: suggest regulatory structures or rules. EFM (network N1) R6 and R9 are an enzyme subset. By contrast, R6 and R9 never occur together with R8 in an EFM. Thus (R6,R8) and (R8,R9) are excluding reaction pairs. (In an arbitrary composable steady-state flux distribution they might occur together.) EP (network N2) The EPs pretend R4 and R8 to be an excluding reaction pair – but they are not (EFM2). The enzyme subsets would be correctly identified. However, one can construct simple examples where the EPs would also pretend wrong enzyme subsets (not shown). Klamt & Stelling Trends Biotech 21, 64 (2003) Bioinformatics III
Comparison of EFMs and EPs Problem Pathway length: shortest/longest pathway for production of P from A. EFM (network N1) The shortest pathway from A to P needs 2 internal reactions (EFM2), the longest 4 (EFM4). EP (network N2) Both the shortest (EFM2) and the longest (EFM4) pathway from A to P are not contained in the set of EPs. Klamt & Stelling Trends Biotech 21, 64 (2003) Bioinformatics III
Comparison of EFMs and EPs Problem Removing a reaction and mutation studies: effect of deleting R7. EFM (network N1) All EFMs not involving the specific reactions build up the complete set of EFMs in the new (smaller) sub-network. If R7 is deleted, EFMs 2,3,6,8 „survive“. Hence the mutant is viable. EP (network N2) Analyzing a subnetwork implies that the EPs must be newly computed. E.g. when deleting R2, EFM2 would become an EP. For this reason, mutation studies cannot be performed easily. Klamt & Stelling Trends Biotech 21, 64 (2003) Bioinformatics III
Comparison of EFMs and EPs Problem Constraining reaction reversibility: effect of R7 limited to B C. EFM (network N1) For the case of R7, all EFMs but EFM1 and EFM7 „survive“ because the latter ones utilize R7 with negative rate. EP (network N2) In general, the set of EPs must be recalculated: compare the EPs in network N2 (R2 reversible) and N4 (R2 irreversible). Klamt & Stelling Trends Biotech 21, 64 (2003) Bioinformatics III
Software: FluxAnalyzer FluxAnalyzer has both EPs and EFMs implemented. Allows convenient studies of metabolic systems. Klamt et al. Bioinformatics 19, 261 (2003) Bioinformatics III
Summary EFM are a robust method that offers great opportunities for studying functional and structural properties in metabolic networks. Klamt & Stelling suggest that the term „elementary flux modes“ should be used whenever the sets of EFMs and EPs are identical. In cases where they don‘t, EPs are a subset of EFMs. It remains to be understood more thoroughly how much valuable information about the pathway structure is lost by using EPs. Ongoing Challenges: - study really large metabolic systems by subdividing them - combine metabolic model with model of cellular regulation. Klamt & Stelling Trends Biotech 21, 64 (2003) Bioinformatics III
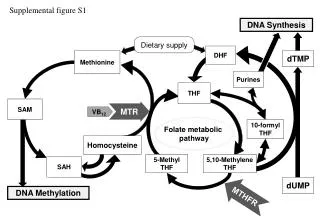
Integrated Analysis of Metabolic and Regulatory Networks Sofar, studies of large-scale cellular networks have focused on their connectivities. The emerging picture shows a densely-woven web where almost everything is connected to everything. In the cell‘s metabolic network, hundreds of substrates are interconnected through biochemical reactions. Although this could in principle lead to the simultaneous flow of substrates in numerous directions, in practice metabolic fluxes pass through specific pathways ( high flux backbone, V20). Topological studies sofar did not consider how the modulation of this connectivity might also determine network properties. Therefore it is important to correlate the network topology (picture derived from EFMs and EPs) with the expression of enzymes in the cell. Bioinformatics III
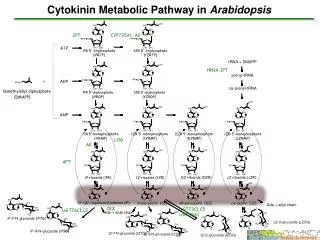
Analyze transcriptional control in metabolic networks Regulatory and metabolic functions of cells are mediated by networks of interacting biochemical components. Metabolic flux is optimized to maximize metabolic efficiency under different conditions. Control of metabolic flow: - allosteric interactions - covalent modifications involving enzymatic activity - transcription (revealed by genome-wide expression studies) Here: N. Barkai and colleagues analyzed published experimental expression data of Saccharomyces cerevisae. Ihmels, Levy, Barkai, Nat. Biotech 22, 86 (2004) Bioinformatics III
Recurrence signature algorithm Availability of DNA microarray data study transcriptional response of a complete genome to different experimental conditions. An essential task in studying the global structure of transcriptional networks is the gene classification. Commonly used clustering algorithms classify genes successfully when applied to relatively small data sets, but their application to large-scale expression data is limited by 2 well-recognized drawbacks: - commonly used algorithms assign each gene to a single cluster, whereas in fact genes may participate in several functions and should thus be included in several clusters - these algorithms classify genes on the basis of their expression under all experimental conditions, whereas cellular processes are generally affected only by a small subset of these conditions. Ihmels et al. Nat Genetics 31, 370 (2002) Bioinformatics III
Recurrence signature algorithm Aim: identify transcription „modules“ (TMs). a set of randomly selected genes is unlikely to be identical to the genes of any TM. Yet many such sets do have some overlap with a specific TM. In particular, sets of genes that are compiled according to existing knowledge of their functional (or regulatory) sequence similarity may have a significant overlap with a transcription module. Algorithm receives a gene set that partially overlaps a TM and then provides the complete module as output. Therefore this algorithm is referred to as „signature algorithm“. Ihmels et al. Nat Genetics 31, 370 (2002) Bioinformatics III
Recurrence signature algorithm normalization of data identify modules classify genes into modules a, The signature algorithm. b , Recurrence as a reliability measure. The signature algorithm is applied to distinct input sets containing different subsets of the postulated transcription module. If the different input sets give rise to the same module, it is considered reliable. c, General application of the recurrent signature method. Ihmels et al. Nat Genetics 31, 370 (2002) Bioinformatics III
Normalize expression matrices Collect from literature expression dataset composed of over 1000 conditions, including environmental stresses, profiles of deletion mutants and natural processes such as cell cycle. Element Egc of the gene expression matrix contains the log-expression change of gene g{1, ..., NG} under the experimental conditions c {1, ..., NC} where NG and NCdenote the total number of genes and conditions, respectively. Introduce 2 normalized expression matrices EGgc and ECgc with zero mean and unit variance with respect to genes and conditions where ...x denote the average with respect to x. Ihmels et al. Nat Genetics 31, 370 (2002) Bioinformatics III
Experiment signature SC The input set consists of NIgenes: Score each experimental condition by the average expression change over the genes of the input set. The condition score is: The experiment signatureSC contains those conditions whose absolute score is statistically significant: Here use tC= 2.0 as the condition threshold level and the standard deviation expected for random fluctuations of Ihmels et al. Nat Genetics 31, 370 (2002) Bioinformatics III
Gene Signature SG In the next step, score all genes by the weighted average change in the expression with the experimental signature. The gene score is: The gene signatureSG contains those genes whose absolute score is statistically significant: Here use tG= 3.0 as the gene threshold level and the measured standard deviation G. Ihmels et al. Nat Genetics 31, 370 (2002) Bioinformatics III
Fusion of signatures Apply signature algorithm to reference input set GIrefand to a set of input sets {GI(i)} that are obtained from GIref ( identify robust modules!) Each set contains a fraction of the „wanted“ genes in GI(i)and some unrelated genes that were selected at random. The result is a reference signature Sref and a collection of modified signatures {Si}. The overlap between any of these signatures and the reference signature is defined as where |...| refers to the size of a set and denotes intersection. Ihmels et al. Nat Genetics 31, 370 (2002) Bioinformatics III
Fusion of signatures All signatures Si whose overlap with the reference signature exceeds a certain threshold are included in the set of recurrent signatures The threshold tR must be chosen to be large enough to discriminate against random fluctuations, but small enough to include a significant fraction of signatures. Here, tR= 70%. A module is obtained by selecting only those genes that appear in at least 80% of all signatures in R. Ihmels et al. Nat Genetics 31, 370 (2002) Bioinformatics III
Fusion of signatures Generate modules from recurrent signatures: To fuse pairs of recurrent signatures {Si, Sj} into transcription modules: For each pair, compute the intersect Pij = Si Sjof genes appearing in both signatures as well as the overlap Select the pair signature Pref with the largest associated overlap OLref as the „seed“ of a new module. Assign all pair signatures Pij whose overlap with Pref exceeded a certain fraction tRof OLref to the set of recurrent signatures R : Ihmels et al. Nat Genetics 31, 370 (2002) Bioinformatics III
Fusion of signatures Obtain gene content and scores of the associated module from R. Remove the pairs that were assigned to R from the total „pool“ of pair signatures {Pij}. To avoid identification of more, less-coherent realizations of the same module, remove also those pairs from R that would have been assigned to R for a somewhat lower value of threshold tR unless they had a significant overlap (~75%) with any other pair signature. This process is iterated until all sets are assigned. Ihmels et al. Nat Genetics 31, 370 (2002) Bioinformatics III
Numerical test Apply algorithm to set of Ncore genes that are known to be co-regulated. Then add Nrandrandomly selected genes. The addition of many random genes leaves the output of the signature algorithm essentially unchanged. In detail: A reference set of Ncore co-regulated genes was composed of genes encoding either ribosomal proteins (dashed lines) or proteins involved in amino-acid biosynthesis (dashed/dotted line). The recurrent signature method was applied to this set as follows. First, a collection of input sets was derived by randomly adding genes to the reference set. Second, the signature algorithm was applied to the reference set and to the derived sets; this generates a reference signature and a collection of perturbed signatures, respectively. Last, the overlaps between the reference signature and the perturbed signatures were calculated. Shown is the average overlap as a function of the number of genes added to the reference set. The different lines correspond to different choices of Ncore, shown in parentheses. Ihmels et al. Nat Genetics 31, 370 (2002) Bioinformatics III
Correlation between genes of the same metabolic pathway Distribution of the average correlation between genes assigned to the same metabolic pathway in the KEGG database. The distribution corresponding to random assignment of genes to metabolic pathways of the same size is shown for comparison. Importantly, only genes coding for enzymes were used in the random control. Interpretation: pairs of genes associated with the same metabolic pathway show a similar expression pattern. However, typically only a set of the genes assigned to a given pathway are coregulated. Ihmels, Levy, Barkai, Nat. Biotech 22, 86 (2004) Bioinformatics III
Correlation between genes of the same metabolic pathway Genes of the glycolysis pathway (according KEGG) were clustered and ordered based on the correlation in their expression profiles. Shown here is the matrix of their pair-wise correlations. The cluster of highly correlated genes (orange frame) corresponds to genes that encode the central glycolysis enzymes. The linear arrangement of these genes along the pathway is shown at right. Of the 46 genes assigned to the glycolysis pathway in the KEGG database, only 24 show a correlated expression pattern. In general, the coregulated genes belong to the central pieces of pathways. Ihmels, Levy, Barkai, Nat. Biotech 22, 86 (2004) Bioinformatics III
Coexpressed enzymes often catalyze linear chain of reactions Coregulation between enzymes associated with central metabolic pathways. Each branch corresponds to several enzymes. In the cases shown, only one of the branches downstream of the junction point is coregulated with upstream genes. Interpretation: coexpressed enzymes are often arranged in a linear order, corresponding to a metabolic flow that is directed in a particular direction. Ihmels, Levy, Barkai, Nat. Biotech 22, 86 (2004) Bioinformatics III
Co-regulation at branch points To examine more systematically whether coregulation enhances the linearity of metabolic flow, analyze the coregulation of enzymes at metabolic branch-points. Search KEGG for metabolic compounds that are involved in exactly 3 reactions. Only consider reactions that exist in S.cerevisae. 3-junctions can integrate metabolic flow (convergent junction) or allow the flow to diverge in 2 directions (divergent junction). In the cases where several reactions are catalyzed by the same enzymes, choose one representative so that all junctions considered are composed of precisely 3 reactions catalyzed by distinct enzymes. Each 3-junction is categorized according to the correlation pattern found between enzymes catalyzing its branches. Correlation coefficients > 0.25 are considered significant. Ihmels, Levy, Barkai, Nat. Biotech 22, 86 (2004) Bioinformatics III
Coregulation pattern in three-point junctions All junctions corresponding to metabolites that participate in exactly 3 reactions (according to KEGG) were identified and the correlations between the genes associated with each such junction were calculated. The junctions were grouped according to the directionality of the reactions, as shown. Divergent junctions, which allow the flow of metabolites in two alternative directions, predominantly show a linear coregulation pattern, where one of the emanating reaction is correlated with the incoming reaction (linear regulatory pattern) or the two alternative outgoing reactions are correlated in a context-dependent manner with a distinct isozyme catalyzing the incoming reaction (linear switch). By contrast, the linear regulatory pattern is significantly less abundant in convergent junctions, where the outgoing flow follows a unique direction, and in conflicting junctions that do not support metabolic flow. Most of the reversible junctions comply with linear regulatory patterns. Indeed, similar to divergent junctions, reversible junctions allow metabolites to flow in two alternative directions. Reactions were counted as coexpressed if at least two of the associated genes were significantly correlated (correlation coefficient >0.25). As a random control, we randomized the identity of all metabolic genes and repeated the analysis. In the majority of divergent junctions, only one of the emanating branches is significantly coregulated with the incoming reaction that synthesizes the metabolite. Ihmels, Levy, Barkai, Nat. Biotech 22, 86 (2004) Bioinformatics III
Co-regulation at branch points: conclusions The observed co-regulation patterns correspond to a linear metabolic flow, whose directionality can be switched in a condition-specific manner. When analyzing junctions that allow metabolic flow in a larger number of directions, there also only a few important branches are coregulated with the incoming branch. Therefore: transcription regulation is used to enhance the linearity of metabolic flow, by biasing the flow toward only a few of the possible routes. Ihmels, Levy, Barkai, Nat. Biotech 22, 86 (2004) Bioinformatics III
Connectivity of metabolites The connectivity of a given metabolite is defined as the number of reactions connecting it to other metabolites. Shown are the distributions of connectivity between metabolites in an unrestricted network () and in a network where only correlated reactions are considered (). In accordance with previous results (Jeong et al. 2000) , the connectivity distribution between metabolites follows a power law (log-log plot). In contrast, when coexpression is used as a criterion to distinguish functional links, the connectivity distribution becomes exponential (log-linear plot). Ihmels, Levy, Barkai, Nat. Biotech 22, 86 (2004) Bioinformatics III
Differential regulation of isozymes Observe that isozymes at junction points are often preferentially coexpressed with alternative reactions. investigate their role in the metabolic network more systematically. Two possible functions of isozymes associated with the same metabolic reaction. An isozyme pair could provide redundancy which may be needed for buffering genetic mutations or for amplifying metabolite production. Redundant isozymes are expected to be coregulated. Alternatively, distinct isozymes could be dedicated to separatebiochemical pathways using the associated reaction. Such isozymes are expected to be differentially expressed with the two alternative processes. Ihmels, Levy, Barkai, Nat. Biotech 22, 86 (2004) Bioinformatics III
Differential regulation of isozymes in central metabolic PW Arrows represent metabolic pathways composed of a sequence of enzymes. Coregulation is indicated with the same color (e.g., the isozyme represented by the green arrow is coregulated with the metabolic pathway represented by the green arrow). Most members of isozyme pairs are separately coregulated with alternative processes. Ihmels, Levy, Barkai, Nat. Biotech 22, 86 (2004) Bioinformatics III
Differential regulation of isozymes Regulatory pattern of all gene pairs associated with a common metabolic reaction (according to KEGG). All such pairs were classified into several classes: (1) parallel, where each gene is correlated with a distinct connected reaction (a reaction that shares a metabolite with the reaction catalyzed by the respective gene pair); (2) selective, where only one of the enzymes shows a significant correlation with a connected reaction; and (3) converging, where both enzymes were correlated with the same reaction. Correlations coefficients >0.25 were considered significant. To be counted as parallel, rather than converging, we demanded that the correlation with the alternative reaction be <80% of the correlation with the preferred reaction. Ihmels, Levy, Barkai, Nat. Biotech 22, 86 (2004) Bioinformatics III
Differential regulation of isozymes: interpretation The primary role of isozyme multiplicity is to allow for differential regulation of reactions that are shared by separated processes. Dedicating a specific enzyme to each pathway may offer a way of independently controlling the associated reaction in response to pathway-specific requirements, at both the transcriptional and the post-transcriptional levels. Ihmels, Levy, Barkai, Nat. Biotech 22, 86 (2004) Bioinformatics III