Download
1 / 27
270 likes | 423 Vues
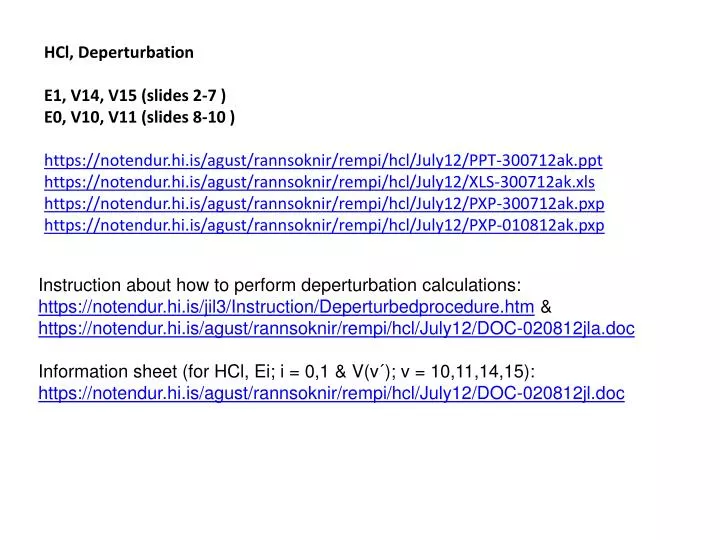
HCl, Deperturbation E1, V14, V15 (slides 2-7 ) E0, V10, V11 (slides 8-10 ) https://notendur.hi.is/agust/rannsoknir/rempi/hcl/July12/PPT-300712ak.ppt https://notendur.hi.is/agust/rannsoknir/rempi/hcl/July12/XLS-300712ak.xls

E N D
HCl, Deperturbation E1, V14, V15 (slides 2-7 ) E0, V10, V11 (slides 8-10 ) https://notendur.hi.is/agust/rannsoknir/rempi/hcl/July12/PPT-300712ak.ppt https://notendur.hi.is/agust/rannsoknir/rempi/hcl/July12/XLS-300712ak.xls https://notendur.hi.is/agust/rannsoknir/rempi/hcl/July12/PXP-300712ak.pxp https://notendur.hi.is/agust/rannsoknir/rempi/hcl/July12/PXP-010812ak.pxp Instruction about how to perform deperturbation calculations: https://notendur.hi.is/jil3/Instruction/Deperturbedprocedure.htm &https://notendur.hi.is/agust/rannsoknir/rempi/hcl/July12/DOC-020812jla.doc Information sheet (for HCl, Ei; i = 0,1 & V(v´); v = 10,11,14,15): https://notendur.hi.is/agust/rannsoknir/rempi/hcl/July12/DOC-020812jl.doc
v1,v2,v3 V15 E1 V14 Unrealistic region 123 W/cm-1 https://notendur.hi.is/agust/rannsoknir/rempi/hcl/July12/PXP-300712ak.pxp Lay:0, Gr:0
HCl, E1, V14, V15 B1 Unrealistic region 123 W/cm-1 https://notendur.hi.is/agust/rannsoknir/rempi/hcl/July12/PXP-300712ak.pxp Lay:1, Gr:1
HCl, E1, V14, V15 D1 Deviation of D1 from 0 is a resonable measure of distortion, i.e. one might expect D1 (unperturbed) to be close to zero analogous to that for X(HCl) (De= 5.3194E-4 = 0.53E-3=+0.00053<= NIST) and X(HCl+) (De= 5.477E-4 = 0.547E-3=+0.000547<= NIST ) Unrealistic region 123 W/cm-1 https://notendur.hi.is/agust/rannsoknir/rempi/hcl/July12/PXP-300712ak.pxp Lay:2, Gr:2
HCl, E1, V14, V15 W12(max)=DE/2 = 246/2= https://notendur.hi.is/agust/rannsoknir/rempi/hcl/July12/XLS-300712ak.xls
HCl, E1, V14, V15 D1 +0.000596! 0 -6.71E-05 -0.00078 124.6 W/cm-1 https://notendur.hi.is/agust/rannsoknir/rempi/hcl/July12/PXP-300712ak.pxp Lay:3, Gr:3
HCl, E1, V14, V15 https://notendur.hi.is/agust/rannsoknir/rempi/hcl/July12/XLS-300712ak.xls
B1 ( ) ( ) ( ) ( ): unrealistic points ( ) D1 => correlation between B1 and D1, i.e. highest B1 value for D1 closest to 0 https://notendur.hi.is/agust/rannsoknir/rempi/hcl/July12/PXP-300712ak.pxp Lay:8, Gr:8
HCl, E0, V10, V11 v1,v2,v3 V11 E0 83697 Unrealistic region V10 W/cm-1 https://notendur.hi.is/agust/rannsoknir/rempi/hcl/July12/PXP-300712ak.pxp Lay:7, Gr:7
HCl, E0, V10, V11 B1 W/cm-1 https://notendur.hi.is/agust/rannsoknir/rempi/hcl/July12/PXP-300712ak.pxp Lay:4, Gr:4
HCl, E0, V10, V11 D1 W/cm-1 https://notendur.hi.is/agust/rannsoknir/rempi/hcl/July12/PXP-300712ak.pxp Lay:5, Gr:5
HCl, E0, V10, V11 B1 D1 => correlation between B1 and D1, i.e. highest B1 value for D1 closest to 0 https://notendur.hi.is/agust/rannsoknir/rempi/hcl/July12/PXP-300712ak.pxp Lay:6, Gr:6
HCl, E0, V10, V11 No significant change in D(v1) https://notendur.hi.is/agust/rannsoknir/rempi/hcl/July12/XLS-300712ak.xls
Let´s perform dep. calculations for different W´s (i.e. WH¹ WL) for E1,V14, V15:
HCl, E1, V14, V15 for W2 = 123 v1 W3 / WH https://notendur.hi.is/agust/rannsoknir/rempi/hcl/July12/PXP-010812ak.pxp; Lay:2, Gr:2
HCl, E1, V14, V15 for W2 = 123 B1 W3 / WH https://notendur.hi.is/agust/rannsoknir/rempi/hcl/July12/PXP-010812ak.pxp; Lay:0, Gr:0
HCl, E1, V14, V15 for W2 = 123 D1 D(D1) = 0 – 0.001 cm-1 W3 / WH https://notendur.hi.is/agust/rannsoknir/rempi/hcl/July12/PXP-010812ak.pxp; Lay:1, Gr:1
HCl, E1, V14, V15 for W2 = 123, W3 CHANGES as above B1 D(D1) = 0 – 0.001 cm-1 D1 https://notendur.hi.is/agust/rannsoknir/rempi/hcl/July12/PXP-010812ak.pxp; Lay:3, Gr:3
HCl, E1, V14, V15 for W2 = 123, W3 CHANGES Only small increase in W3 from 123 to about 129 (for W2 = 123) -improves D1 (= +0.0006 cm-1) -increases B1 from 9.97 to 10,096 cm-1 -causes small increase in v1 ( 85845 -> 85848 cm-1) https://notendur.hi.is/agust/rannsoknir/rempi/hcl/July12/XLS-300712ak.xls
I tried • –to fix D1, and to vary W2 & W3 => W2 = 123 W3 = 110 +/- big error (typically)! • - to use W2 = 125 and to vary W3 => W3 ca. 125 best!
Now let´s check E0,....: Comparison with Fields work: https://notendur.hi.is/agust/rannsoknir/papers/HCl/jcp109-8374-98.pdf: Try this
v1 W3 / WH https://notendur.hi.is/agust/rannsoknir/rempi/hcl/July12/PXP-020812ak.pxp ; Lay:6, Gr:6
HCl, E0, V10, V11 for W2 = 187 B1 W3 / WH https://notendur.hi.is/agust/rannsoknir/rempi/hcl/July12/PXP-020812ak.pxp ; Lay:4, Gr:4
HCl, E0, V10, V11 for W2 = 187 D1 D(D1) = 0 – 0.001 cm-1 W3 / WH https://notendur.hi.is/agust/rannsoknir/rempi/hcl/July12/PXP-020812ak.pxp ; Lay:5, Gr:5
HCl, E0, V10, V11 for W2 = 187, W3 CHANGES as above B1 D1 https://notendur.hi.is/agust/rannsoknir/rempi/hcl/July12/PXP-020812ak.pxp ; Lay:7, Gr:7
No significant change in D(v1) https://notendur.hi.is/agust/rannsoknir/rempi/hcl/July12/XLS-300712ak.xls
Now it looks like: 1) E1: B1= 10.10, D1 = +0.0006 , W2 = 123, W3 = 129 2) E0: B1= 9.01, D1= +0.0004, W2 = 187, W3= 193.5 2) Could it be that W2 <187 and W3 > 193.5 For E0, V10,V11? Search for D1 <0.001 and B1 > 9.01 for E0, V10,V11 => By trying W2 =180 and varying W3 > 180 => B1(max)= 8.37 only for D1(min) = -0.0051 (for W3 = 197) and V1= 83755 (which is even higher and makes D(v1) still smaller Ergo: this is not convincing Could W2 > 187 and W3 still higher? Tried: W2=190 and varying W3 >190 =>B1(max)= 9.1 for D1(min) = 0 (for W3 = 193) and V1 = 83700 => no big change in D(v1) & Tried: W2 = 195 and varying W3 > 195 =>B1(max)=9.2 for D1(min) = -0.0009 (NB D1 <0, always)V1 = 83709 => no big change in D(v1) Best Results! In agreement with Field et al.! No improvements! See: https://notendur.hi.is/agust/rannsoknir/rempi/hcl/July12/XLS-300712ak.xls