Download
1 / 17
170 likes | 336 Vues
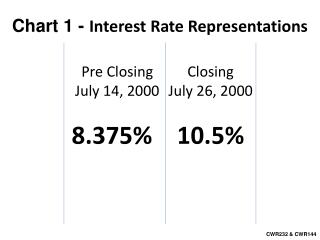
Chart 1 - Interest Rate Representations. Closing July 26, 2000. Pre-Closing July 14, 2000. 10.5%. 8.375%. CWR232 & CWR144-146. Chart 2 -Truth in Lending Representations . Pre-Closing July 14, 2000. Closing July 26, 2000. Post-Closing Jan. 14 , 2004. 12.899%. 14.350%. 15.11%.

E N D
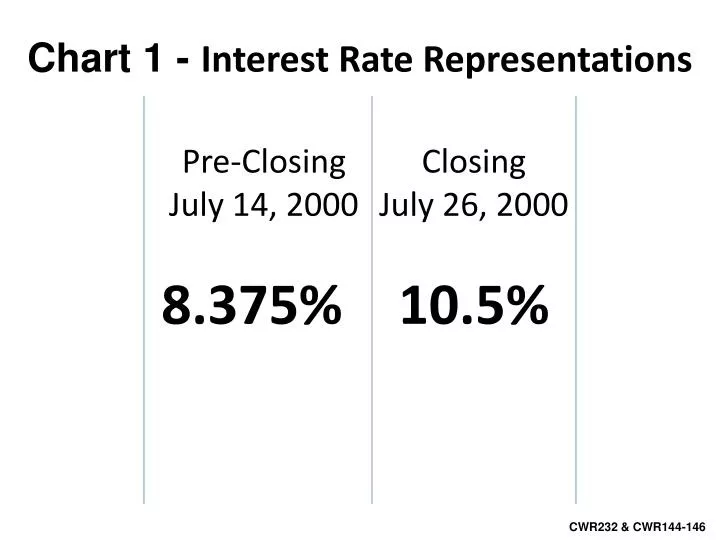
Chart 1 - Interest Rate Representations ClosingJuly 26, 2000 Pre-ClosingJuly 14, 2000 10.5% 8.375% CWR232 & CWR144-146
Chart 2 -Truth in Lending Representations Pre-ClosingJuly 14, 2000 ClosingJuly 26, 2000 Post-ClosingJan.14, 2004 • 12.899% 14.350% 15.11% CWR121 & CWR231
Chart 3 - Monthly Payment Pre-ClosingJuly 14, 2000 ClosingJuly 26, 2000 Post-Closing2000-2004 • $353.43 $472.01 $526.90 CWR231, CWR232, CWR121 & 9a Exhibit Payment/Escrow Detail - 3134022
Chart 4 - Interest Rate Comparison “Good Faith Estimate”, “TILDS” vs. “Actual” “Approximately Double 8% to16%” • Note: Actual = Includes fees, force placed insurance (home and flood) and misc… • Almost doubled the interest rate (difference of 7.336%) CWR232, CWR121 & 9a Exhibit Payment/Escrow Detail - 3134022
Chart 5 - Finance Charge Comparison “Good Faith Estimate”, “Truth in Lending Disclosure Statement” &”Actual” “Nearly, $100,000 difference in total Finance Charge” Difference in cash finance charge over the life of the loan Faith to TILDS $83,986.67 & Faith to Actual $173,108.61-$79,996= $93,112.61” 9a Exhibit Payment/Escrow Detail - 3134022
Chart 6 - Monthly Payment “Good Faith Estimate”, “Truth in Lending Statement” & “Actual” • “8.375% , 14.350% and 15.711% • Monthly charge Difference of Good Faith to TILDS $173.47 • and Good Faith to Actual $353.43- $609.00= $255.57” 9a Exhibit Payment/Escrow Detail - 3134022
Chart 7 – Payment History July 14, 2000 January 2004 $472.01-$992.02 $353.42 Total Payments Total Actual Payments $10,249.47 $18,232.66 CWR232 & 9a Exhibit Payment/Escrow Detail - 3134022
Chart 8 – Money Orders Sent to Countrywide Home Loans Payments 4/16/2001 5/10/2001 6/8/2001 6/26/2001 Misc. Posting Misc. Posting Subtotal 7/16/2001 Acct. No.# 8577 8843 3324 393.36 78.65 4141 472.01 472.01 472.01 472.01 472.01 $1,888.04 Un-posted Money Orders See Money Order Exhibit
Chart 9 – Payments Made Dates range 7/14/00 to 12/5/03 Payments Made
Chart 9a – Principal Payments Made Principal payments made Note: no pre-payment penaltyJan. 2004 “Prepaid Note in Full” $55,320.81 Total • 50,926.34 Payoff • $4,394.47 Over-Payment $42,124.96 • Feb. 14, 2005 $6,282.97 • Reversal of fees, force placed insurance • (home and flood) and misc… $6,912.88
Chart 10 – Payments due@ 472.01 (39 months) September 1, 2000 to December 1, 2003 $472.01 X 39 $18,408.39
Chart 11 - Dates range 7/14/00 to 12/5/03 Total Misc., Fees & Insurance Total of Interest, Insurance, Misc. Postingand Fees Chart 2a 9a Exhibit Payment/Escrow Detail - 3134022
Chart 12 – Back out Fees, Misc. Posting, Insurance from Ex. 9a (Except County Taxes) Total Fees Less County Taxes Subtotal Less payment Final reversal $9,125.94 <1,476.33> <264.72> $7,384.89 < 472.01 > $6,912.88
Chart 13 – Over Payment of the Note • Payments Due $472.01 • Sept. 2000-Dec. 2003 (39) • Chart 10 Principal and Interest • Payments Made Exhibit 9a • Chart 7 Principal and Interest • Net Interest Due as of Dec. 31, 2003 (Recalculation of Interest Due Assuming all Payments made are Posted) Balance As of Dec. 2003 • Judgment Principal Due • and Interest Due • Total Principal and Interest Due as of December 1, 2003 • Actual Payments Made: Note: reversal of fees from Chart 9a $18,408.39 18,232.66 $ 175.73 $50,926.34 $ 175.73 $ 51,102.07 $ 55,320.81 $4,218.74 $42,124.96 $6,282.97 $6,912.88 Grand Total of: Over Payment:
Option 1 $20 per day Amount of time June 5, 2003-April 5, 2011 & over- payment (2,225 days)=$67,611.31 Interest rate 8.375% Hardship for living in a burnt home (Range of 80,000 to 150,000) Total = $183,242.00-$333,242.00 Option 2 Rent $750 per month Amount of time June 5, 2003-April 5, 2011 & over-payment (106 Months) = $82,611.31 Interest rate 10.5% Hardship for living in a burnt home (Range of 80,000 to 150,000) Total = $272,043.00-$422,043.00 Chart 14 – Present Value of Damages Due to Displacement and Loss of Use • Option 3 • Rent $950 per month includes utilities • Amount of time June 5, 2003-April 5, 2011 & over-payment (106 Months) = • $100,700 • Interest rate 15.711% • Hardship for living in a burnt home (Range of 80,000 to 150,000) Total = $493,863.00- $643,863.00
Chart 15 - Countrywide Financial • Countrywide Home Loans Accounts for 48% of Countrywide Financial Corporation (NYSE: CFC) Annual Report 2006 - 10K
Chart 16 - Countrywide Home Loan, Inc. (NYSE: CFC)Shareholder’s Equity (48%) 2007 $7.034 Billion 2006 $6.872 Billion 2005 $6.151 Billion 2004 $4.948 Billion 2003 $3.880 Billion