Download
1 / 25
250 likes | 345 Vues
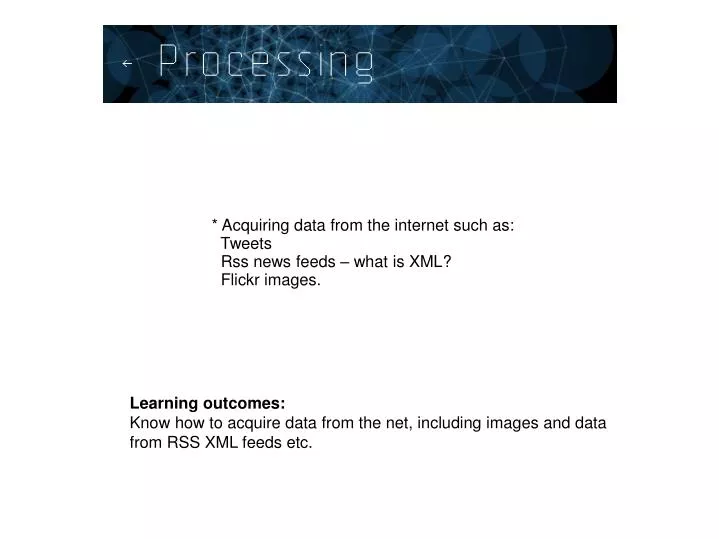
* Acquiring data from the internet such as: Tweets Rss news feeds – what is XML? Flickr images. Learning outcomes: Know how to acquire data from the net, including images and data from RSS XML feeds etc. Grabbing data from the net. Importing an image from the web:.

E N D
* Acquiring data from the internet such as: Tweets Rss news feeds – what is XML? Flickr images. Learning outcomes: Know how to acquire data from the net, including images and data from RSS XML feeds etc.
Importing an image from the web: Will not work in an applet because of Java security constrictions.
Get data from Tweets,here I've started to draw ellipses if certain words appear in the Tweet This sketch uses the romeFeeder library which I've put in the sketch folder so it will work for you
RSS feedsRSS = Rich Site Summary Rich Site Summary is a format for delivering regularly changing web content. Many news-related sites, weblogs and other online publishers syndicate their content as an RSS feed to whoever wants it. The BBC, yahoo and thousands of other organisations release constantly updated RSS feeds for news, sport etc etc. In order to understand how to use RSS feeds we need to know a bit about XML Good tutorial on reading XML: http://www.learningprocessing.com/tutorials/simpleml/
XMLExtensible Markup Language RSS feeds are written in XML format. This is a format designed to facilitate the sharing of data acrosss different sytems. XML uses a tree structure to represent data. For example if we stored information about students we might have a tsructure like this, Each student would have elements describing their id, address, email etc, the adress Element might have further elements such as street number, postal code, city etc. This is A conceptual diagram, on the next page we see the actual html file as it would be on the web
Below examlpe of xml with two student's data – ahh it's Daniel Shiffman and Zoog! You could add the data for many more students in-between further <student> </student> tags. In Processing we loop through the Xml and grab the data we want, we can do this ourselves (it's called 'parsing') or we can use a nice xml library that makes it easy and synchronous, meaning our program can get on with stuff while we parse the data (the opposite is an Asynchronous request, which makes us wait until the request, or search for data, is complete.)
So, in short Xml consists of nested sets of elements and attributes.Elements look like this:<person> <gender>female</gender> <firstname>Anna</firstname> <lastname>Smith</lastname></person>And attributes look like this,<person gender="female"> <firstname>Anna</firstname> <lastname>Smith</lastname></person>they have a name and a value with an = sign. Not very different andnothing for us to worry about.
Xml can also have 'child' elements: http://www.tizag.com/xmlTutorial/xmlchild.php
Also check out various Yahoo libraries for Processing – infact there are a lot of different libaries for getting data. http://processing.org/reference/libraries/
Get the weather in London todayreads an RSS feed. The size of the ellipse is defined by the temperature
Pachube – provides a lot of feeds and tools, plus a tutorial on using it with Arduino to provide remote sensing. You can also upload sensor data to Pachube from your Arduino http://community.pachube.com/?q=node/13
http://kavasmlikon.wordpress.com/2011/11/23/processing-how-to-create-real-time-info-graphics-with-sensor-data-from-pachube/http://kavasmlikon.wordpress.com/2011/11/23/processing-how-to-create-real-time-info-graphics-with-sensor-data-from-pachube/
================================================================================================================================================== 3.5 Harvesting sensor data from Pachube ========================================================================= // Basic example to retrieve data from an existing Pachube feed // Pulling in data from a light sensor import eeml.*; DataIn dIn; float ldr_float; int ldr_int; void setup(){ // set up DataIn object; indicate the URL, your Pachube API key, and update requency // e.g. every second is 1000 dIn = new DataIn(this,"http://www.pachube.com/api/17597.xml", "a3570b170f0fcad32c8fbc0f80ad6cb57b1c8283bbb8dae6ade5b954699cc234", 1000); } void draw() { background(ldr_int); } // onReceiveEEML is run every time your app receives back EEML requested from a Pachube feed. void onReceiveEEML(DataIn d){ ldr_float = d.getValue(0); // get the value of the stream 0 ldr_int = int(ldr_float); // convert to a whole number print("GOT: "); // print out what we got println(ldr_int); // print out what we got }
Pachube provides light sensor data which I feed into my sketch
What they say: If you are.... ... a consumer, you might connect up your electrity meter to track it over time, embed usage graphs in your own website, calculate your realtime carbon footprint or use iPhone or gPhone applications to monitor it remotely ... a tinkerer, you might connect up basic home-automation devices, so that you can control them, or have them respond to your office or distant family's environment ... virtually-inclined, you might have your Second Life environment respond to sensors in the realworld (or vice versa) ... an architect, you might use site-specific realtime sensor data to modulate (or generate) a Sketchup model, or use EEML data in conjunction with IFC-compliant models (as can be exported from AutoCad, etc.) to undertake post-occupancy evaluation ... a facilities manager, you might connect up specific outputs from your Building Management System, so that specific data items (like current energy consumption or temperature level) can be shared with the public without compromising security ... a property developer, you might connect together several buildings to allocate resources or monitor energy consumption and occupancy ... a product designer, you might design a set of networked objects, lamps or furniture that react to each other at a distance, even from either sides of the planet ... a device designer, you might create a population of mobile gadgets that makes use of ad-hoc and one-to-many sensor connections, or USB dongles that respond to each other at a distance ... a maker, you might build blogjects and devices based on Arduino that can connect to each other across the network, or share their realtime sensor data with dozens of others ... an interaction designer, you might build environments that respond to climate data from different parts of the world (or, perhaps, other interactive environments) ... a graphic designer, you might create dynamic realtime visualisations (using Processing or Flash) of physical sensor data ... a web designer, you might build a website that responds in realtime to conditions or interactions in the physical world (for example, by using javascripts to change document elements dynamically in response to sensor data) ... a wearables designer, you might produce smart clothing or footwear that connects and interacts across the network and foster communities around people who wear them ... a developer, you might webscrape interesting data to add it to the repository or route feeds via other web services to create mashups ... a blogger, you might subscribe to RSS or Atom feeds of particular sensor taggings, and get updates when new feeds are added ... a games designer, you might create networked or online game that enable players to interact across the planet, or respond to conditions in the physical world ... a sociologist, you might monitor communities of geographically-specific sensor data in order to inform the design or participation process ... an urban designer, you might track pollution and climate data from a section of the city and embed this data in external websites for public information purposes ... a researcher, you might log sensor histories over time, export graphs and compare aggregates of similar sensor types ... a fleet or stock owner, you might track, and make public or private, the location and status of individual vehicles, ships, inventory or livestock ... a space scientist, you might extract individual data items from a spacecraft (like "interplanetary magnetic field") and make them available for public dissemination
Good tutorial for Pachube: http://kavasmlikon.wordpress.com/2011/11/23/processing-how-to-create-real-time-info-graphics-with-sensor-data-from-pachube/
You have to sign up to Pachube to use the feeds, it's impressive the different kinds of data you can feed right into Processing and Arduino from all over the world. One student made a lampthat warns you if a sensor near Fukushima Nuclear power plant reads lethal levels of radioactivity. http://doc.gold.ac.uk/%7Ema001nm/physical-computing/fukushima_lamp.html
Project Gutenberg In Learning Processing Daniel Shiffman points out: “Loading text from a URL need not only be an exercise in parsing out small bits of information. It is possible with Processing to analyze large amounts of text found on the web from news feeds, articles, and speeches, to entire books. A nice source is Project Gutenberg ( http://www.gutenberg.org/ ) —which makes available thousands of public domain texts. Algorithms for analyzing text merits an entire book itself, but we will look at one simple beginner example here. Example 18-6 retrieves the entire text of Shakespeare’s play King Lear , and uses split Tokens ( ) to make an array of all the words in the play. Th e sketch then displays the words one by one, along with a count of how many times the word appears in the text. Example 18-6: Analyzing King Lear overleaf:” http://www.gutenberg.org/
Remember all of this data can be fed into an Arduino via Serial. Or by wifi/Etherent (but more complex)