Download
1 / 6
60 likes | 154 Vues
Measuring Market Structure. Concentration ratios

E N D
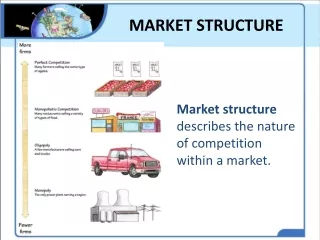
Concentration ratios We have seen that the two polar extremes of market structure are monopoly, with one firm, and perfect competition, where there are many firms. Plus, we saw that the perfect competition situation was more efficient in the sense that total surplus for producers and consumers together was maximized. In the real world of business we see the number of firms varies from industry to industry. In an attempt to find a numerical measure to indicate which industries are more like monopoly and which are more like competition, concentration ratios were devised. Concentration ratios typically use percentage of output produced as the concept used in the numerical measure.
Concentration ratios • CRn is the output added across the n largest firms in an industry divided by the total industry output(and then multiply the result by 100 to be in percentage terms). For example, CR4 is the output of the 4 largest firms added together divided by total output in the industry. • Examples • Monopoly industry –> CR4 = 100, • Industry with 4 firms of equal size (25% of sales for each) -> CR4 = 100. • Can you tell which of the examples above has only one firm by just looking at the CR4? Of course not!
More examples: • 10 firms, each with 10% of market -> CR4 = 40, • 4 firms, each with 10%, and 30 firms, each with 2% -> CR4 = 40. • Here we have two examples of industries where the CR4 is the same. But we see the remaining firms after the top 4 are very different in each example. You would see this by looking at the CR8, but not all the time. So, another measure has been added and the measure considers all the firms in an industry (or maybe the top 50 firms). The measure is the HHI
Herfindahl-Hirschman Index – HHI • To get the HHI we need the market share of each firm in percentage terms. Then we square the market share of each firm. After this, simply add the squared market share of each firm to get the final number. • Examples • Monopoly -> HHI = 1002 = 10,000. This is as big as you can get. • 4 firms with 25% each -> HHI = 252 + 252 + 252 + 252 = 2500 • 10 firms each with 10% -> HHI = 10 times 102 = 1000. • 4 firms with 10%, 30 firms with 2% -> HHI = 4 times 102 plus 30 times 22 = 400 + 120 = 520.
HHI The closer the HHI is to 10,000 the more the industry is like a monopoly. The closer to 0 the more the industry is like a competitive industry. Issues with CR4 or HHI How do we define a market? At issue is how narrow or broad do we define the industry. Is aluminum foil and waxed paper in the same market? What about that plastic wrap that gets all stuck together before you cover the food? Should that be included with the aluminum foil and waxed paper? The relevant geographical market also has to be settled. These issues have to be settled before we can even calculate the CR4 or the HHI.