Download
1 / 54
540 likes | 557 Vues
Detecting Alternative Splicing using the Human Affymetrix Exon Array 1.0. Instructors: Jennifer Barb, Zoila Rangel, Peter Munson June 15, 2009. Mathematical and Statistical Computing Laboratory Division of Computational Biosciences. Background. Gene structure.

E N D
Detecting Alternative Splicing using the Human AffymetrixExon Array 1.0 Instructors: Jennifer Barb, Zoila Rangel, Peter Munson June 15, 2009 Mathematical and Statistical Computing Laboratory Division of Computational Biosciences
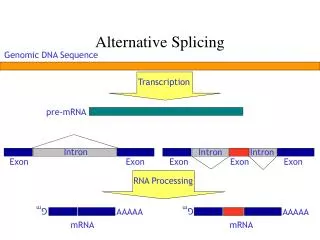
Gene structure Source: http://genome.wellcome.ac.uk/doc_WTD020755.html
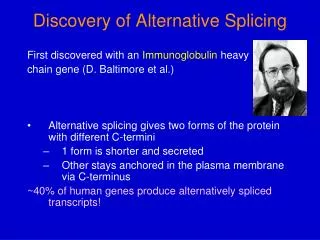
Alternative splicing • 40-60% of the genome is alternatively spliced (AS) • AS increases mRNA and protein diversity • ~20,000 genes give rise to more than 100,000 different functioning proteins because of AS • AS events account for the disparity between the number of human genes and the number of human expressed sequences (mRNAs), transcript isoforms
Classic AS example of tissue specific splicing Source: http://genetics.hannam.ac.kr/note/Processing%20of%20hnRNAs.htm
Different types of AS events 1/3 of all cases Both comprise 1/4 of all cases Last 4 events, represent minority of all AS cases B.J. Blencowe. Alternative splicing: new insights from global analyses. Cell, 126: 37-47, Jul 2006.
Screening for alternative splicing using the exon array • Investigate changes in gene expression on the isoform level • Identify novel AS events, estimate occurrence of in different applications: • Tissue types • Disease states • Response to treatment • Knock out gene models • In mammalian development • Many more
Types of high-throughput screening for AS • 1. Next Generation Sequencing (not covered today) – builds on idea of serial analysis of gene expression (SAGE) • Thorough measurement of a nucleic acid profile generating huge numbers of short sequencing reads • 1. RNA-Seq • 2. ChIP-Seq • 3. Methyl-Seq • 2. Exon Microarrays – sequence must be known prior to study • Exon based probes interrogate known exons within a gene • Exon splice junction probes interrogate exon-exon splice junctions and investigates idea of exon skipping
Detecting alternative splicing using exon microarrays • ExonHit Human GW spliceArray on Affymetrix platform • Similar to Affy Exon array except has splice junction probes • Affymetrix Human Gene 1.0 ST array • Expression array offering whole transcript coverage • Uses a subset of probes from the Human exon 1.0 ST array • Affymetrix Human Exon 1.0 ST array • 4 probes per exon, allows for gene expression and alternative splicing detection
How is the exon chipdifferent from 3’ IVT arrays? 3 different isoforms of same gene Gene http://www.affymetrix.com/products_services/arrays/specific/hugene_1_0_st.affx
The Affymetrix Human Exon 1.0 ST array • Substantially higher probe density than traditional gene expression microarrays • 6.5 million probes, comprising 1.4 million probesets, targeting 1.2 million exons • Goal of array: target every known and predicted exon in the genome • Allows for genome-wide screening of AS events of multiple genes
Affy exon chip annotations • Affy’s basic approach: • 1. A variety of sources used to construct gene annotations • Exon probesets map to gene annotations • Probesets grouped together when map to same gene annotation • Transcript clusters (TC) closely resembles a gene Affymetrix. Exon Probeset Annotations and Transcript Cluster Groupings. Aymetrix Whitepaper Collections, pages 1-11, 2005.
RMA Intensity Genomic Location Affy annotation problem GJA10 gene Contains 15 probesets Encompasses 2 genes MYCBP gene 2 PSR’s in genomic region where no gene is found
Annotation problemscontinued Source: UCSC Genome Browser, http://genome.ucsc.edu
How often does a TC include more than one gene? • “Core” exon annotations downloaded from Affymetrix Expression • Console (EC, Feb 2009) • 287, 329 core probesets • 17,583 transcript clusters • 567 Transcript clusters annotated to more than one gene • 629 gene symbols annotated to more than one transcript • cluster **Solution: Reannotate exon chip!
Reference Sequence (RefSeq) project at the NCBI • Comprehensive, non-redundant set of sequences • Genomic DNA, transcript RNA and protein products • Stable reference for genome annotation http://www.ncbi.nlm.nih.gov/RefSeq/
Steps for exon array reannotation 1. Download RefSeq database from UCSC 2. Create continuous, non-overlapping set of exons for each gene from RefSeq transcripts 3. Map Affy probesets to RefSeq exons by genomic location
Statistical software available for the analysis of exon microarrays MSCL Toolbox JMP Genomics Partek Genomics Suite Li and Wong Bioconductor Array Assist ***Very active area of development
Mixed-effect, 3 factor ANOVA(test applied to each gene) Effect for alternative splicing 2 fixed, one random effect Ai Treatment effect (fixed) βj(i) Sample within treatment effect (random) Ck Exon effect (fixed) ACik Treatment-exon interaction effect (fixed) εijk error term LPS or control Replicate within treatment Exon effect within a gene Exon*tissue interaction
Filtering methods Pre-analysis – excluding probesets from the analysis • Do not include probesets who do not reach a particular maximum intensity over all treatments • Do not include probesets whose range across all treatments is low Post-analysis – filter out non-significant genes • Apply a p-value cutoff filter • Apply a magnitude of interaction effect filter
MaxIntensity_Tissues Range_Tissues Pre-Analysis filters • “Dead” probeset • Calculate maximum over all treatments (maxIntensity) • Plot distribution of maxIntensity • Determine first quartile of distribution of maxIntensity • First quartile used as threshold for “dead” probeset • “Unresponsive” probeset • Calculate minimum over all treatments (minIntensity) • Calculate Range by maxIntensity-minIntensity • Determine first quartile of distribution of Range • First quartile used as threshold for “unresponsive” • probeset
Example of dead/absent probesets within a gene Green represents exon/probeset with low MaxIntensity across samples RMA intensity Controls Treated samples Probesets whose maximum intensity across all samples never make it above a certain threshold will not be included in the analysis. Green lines represent probesets/exons never going above 3.
Low-range probeset Green represents exon/probeset with low range across samples RMA intensity Controls Treated samples Each line represents an exons RMA intensity across each treatment. Y-axis is RMA Intensity value. X-axis represents different treatments used in the study.
Post-analysis filters • Cutoff criteria of p-ACik for treatment-tissue interaction p-ACik < 1e-7 • Cutoff criteria of maximum absolute interaction effect (maxAbsInt) ACik maxAbsInt> 1 or 2
Volcano plot showing post-analysis filter thresholds 348 AS genes
Datasets • Affymetrix tissue dataset (www.affymetrix.com) • 11 different tissue types, 3 replicates each • Testes, breast, spleen, kidney, liver, muscle, thyroid, pancreas, heart, cerebellum and prostate • LPS dataset (data from collaborative lab at the NIH) • THP1 cells infected with LPS (N=5) • uninfected THP1 cells as controls (N=4) • (**THP1 cells - human acute monocytic leukemia cell line. • - good biological sample for prominent inflammatory effect)
Filtering on Range of LPS data Filtering on range of LPS data alone Filters out 41,294 probesets, 25% of the data Addition of tissue dataset, allows for probeset rescue Choose to filter out “Uniformly Unresponsive” in both current datasets and anatomical dataset Filters out 25% of probesets
Range of LPS dataset vs. range of tissue dataset 41,294 probesets do not pass LPS range filter
17,766 Uniformly Unresponsive Probesets removed 23,528 rescued probesets Rescuing probesets who are NOT “Uniformly Unresponsive”
Exon analysis steps Data Import: Obtain RMA values for exon chip from EC Export Affy pivot table from EC Import pivot table into JMP Formatting and annotating data in MSCL Toolbox: Run ParseAffyPivot and RecodeAffyPivot scripts in MSCLtoolbox Annotate exon chip using MSCLtoolbox script (RefSeq or Affy) Pre-Analysis Filters, post-analysis filters and Statistical Analysis Decide threshold values for pre-analysis filters Run ExonANOVA script in MSCLtoolbox Investigate ExonLevel and GeneLevel output files Visualization: Create overlay plot of interesting AS genes View interesting genes in UCSC Genome Browser
Data Analysis Flow to determine AS gene list Normalize data and import to JMP Validate with RT-PCR **Annotate data (RefSeq or Affy) Obtain list of AS genes Apply p-value filter and maxAbsInt filter Determine first quartile of Range and maxIntensity Apply statistical test 3 factor, mixed effect ANOVA Filter out “dead” and “unresponsive” probesets
Import pivot table into JMP (text import preview)
Data Analysis Flow to determine AS gene list Normalize data and import to JMP Validate with RT-PCR **Annotate data (RefSeq or Affy) Obtain list of AS genes Apply p-value filter and maxAbsInt filter Determine first quartile of Range and maxIntensity Apply statistical test 3 factor, mixed effect ANOVA Filter out “dead” and “unresponsive” probesets
Annotate Exon chip – choose applicable chip (RefSeq or Affy)
Data Analysis Flow to determine AS gene list Normalize data Validate with RT-PCR **Annotate data (RefSeq or Affy) Obtain list of AS genes Apply p-value filter and maxAbsInt filter Determine first quartile of Range and maxIntensity Apply statistical test 3 factor, mixed effect ANOVA Filter out “dead” and “unresponsive” probesets
ExonANOVAnested continuedSelect probeset or exonID and geneID
Data Analysis Flow to determine AS gene list Normalize data Validate with RT-PCR **Annotate data (RefSeq or Affy) Obtain list of AS genes Apply p-value filter and maxAbsInt filter Determine first quartile of Range and maxIntensity Apply statistical test 3 factor, mixed effect ANOVA Filter out “dead” and “unresponsive” probesets
Selection of AS genes using a volcano plot 36 genes selected
Overlay plot of 1 gene on AS list:MMP9 gene RMA Intensity Exon Genomic Start Location