Download
1 / 24
240 likes | 249 Vues
‘Gene Shaving’ as a method for identifying distinct sets of genes with similar expression patterns Tim Randolph & Garth Tan Presentation for Stat 593E May 15, 2003. Presentation Outline. Biology Background Reminder of Principle Component Analysis What is Gene Shaving ?

E N D
‘Gene Shaving’ as a method for identifying distinct sets of genes with similar expression patterns Tim Randolph & Garth Tan Presentation for Stat 593E May 15, 2003
Presentation Outline • Biology Background • Reminder of Principle Component Analysis • What is Gene Shaving ? • The ‘Gene Shaving’ Algorithm • Applications of Gene Shaving • Conclusions
What is “gene expression”? • Each cell contains a complete copy of all genes. • The difference between a skin cell and bone cell is determined by which genes are producing proteins i.e., which genes are being “expressed”. • The expression of DNA information occurs in two steps: • Transcription: DNA mRNA • Translation: mRNA protein • DNA microarrays measure transcription (i.e., the mRNA produced)
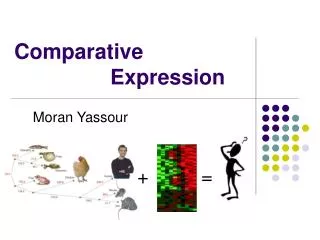
Reference cells sample test cells sample Transcription Label with dye Hybridize to array
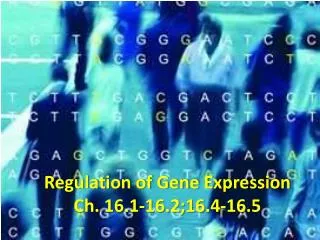
The Dataset • N x pexpression matrix X: • p columns (patients) • N rows (genes) • Green: under-expressed genes. • Red: over-expressed genes. • X = [xij ]
The ratio of the red and green intensities for each spot indicates the relative abundance of the corresponding DNA probe in the two nucleic acid target samples. Xij = log2 (R/G) Xij < 0, gene is over expressed in test sample relative to reference sample Xij = 0, gene is expressed equally Xij > 0, gene is under expressed in test sample relative to reference.sample.
Remarks • Knowing the list of human genes does not mean we know what they do. • cDNA arrays help study the variation of gene expression across samples (e.g., tissues, or patients). • Major challenge is interpreting data that consists of the expression levels of, say 6000 genes and 50 patients. • Present goal: create a clustering that organizes genes with coherent behavior across samples.
1st eigengene (principal component of XT) Singular value decomposition of XT: XT = U S VT s1 v1 g1 g2 gN u1 = sr XTV= U S s1 u1 = XTv1 = linear comb. columns of XT (genes) with highest variance
Introduction • What is Gene Shaving ? • A new statistical method that identifies subsets of genes with coherent expression patterns and large variation across different conditions • Differs from hierarchical clustering and other widely used methods for analyzing gene expression in that genes may belong to more that one cluster.
Estimating the Optimal Cluster Size K • Gene Shaving requires a quality measure for a cluster • To select a good cluster, the method focuses on high coherence between members of the cluster
Estimating the Optimal Cluster Size K (cont.) • The method defines the following measures of variances for a cluster Sk: • The ‘Between Variance’ is the variance of the mean gene • The ‘Within Variance’ measures the variability of each gene about the average
Estimating the Optimal Cluster Size K (cont.) • A useful measure for choosing cluster size is the percent variance: • A large R2 implies a tight cluster of coherent genes • Gene Shaving uses this measure for selecting a cluster from the shaving sequence Sk
Estimating the Optimal Cluster Size K (cont.) • Once a cluster is selected from the sequence, we can proceed to finding the optimal cluster size • Let Dk be the R2 measure for the k-th sequence member. • We wish to find the “Gap” between this value Dk and D*bk, which is the R2 measure for cluster S*bk • This S*bk is the clustering sequence from a permuted matrix X*b
Estimating the Optimal Cluster Size K (cont.) • The “Gap” function is defined as: Where D*k is the average of D*bk over b. • The optimal cluster size K is selected such that this “Gap” is the largest:
So Far: form clusters Sk with • high variance across samples; • high correlation among genes within a cluster; • low correlation between genes in different clusters. The procedure seeks clusters Sk by maximizing v(Sk) = var(vector of col. avgs.) Now incorporate supervision: use info, y, about the patients, and seek Sk by maximizing (1- a) v(Sk) + a J( v(Sk) , y )
Goal is in predicting patient survival • Find genes whose expression correlates with patient survival. • Produce groupings of patients which are statistically different in survival. • Use additional information about the patients,y = (y1,…, yp), and combine unsupervised & supervised criteria into the objective function: (1- a) v(Sk) + a J( v(Sk) , y ) 0 a 1
Maximize (1- a) v(Sk) + a J( v(Sk) , y ) • Information measure J(v(Sk), y) is a quadratic function that depends on the type of patient information, y. • y = (y1,…, yp) may identify catagories of patients. • Used here: y = (p patient survival times), and J(v(Sk), y) = g gT where g is the score vector of the Cox model for predicting survival.
They chose a = 0.1 as it “seemed to give a good mix of high gene correlation and low p-value for the Cox model”.
This produced a cluster of 234 genes. It includes “strong” genes for predicting survival (130 of the 200 stongest) as well as some“weak” genes (e.g., #1332).
Gap curve for supervised shaving. • Survival curves in the two groups defined by the low or high expression of the 234 genes. • Group I has high expression of positive genes, and low expression of negative genes; • Group 2 has low expression of positive genes, and high expression of negative genes. • Negative genes are those preceded by a minus sign in Table 2.
Conclusions • The proposed gene shaving methods search for clusters of genes showing both high variation across the samples, and correlation across the genes. • This method is a potentially useful tool for exploration of gene expression data and identification of interesting clusters of genes worth further investigation