Download
1 / 36
360 likes | 502 Vues
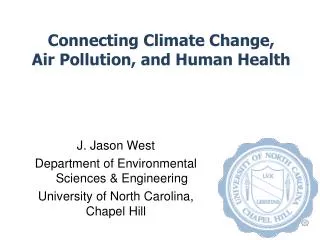
Connecting Air Pollution, Climate Change, and Health. J. Jason West Dept. of Environmental Sciences and Engineering University of North Carolina. Smog Bothers Pedestrians, Los Angeles (1950s). Hollywood Citizens News Collection, Los Angeles Public Library. A global picture.

E N D
Connecting Air Pollution, Climate Change, and Health J. Jason West Dept. of Environmental Sciences and Engineering University of North Carolina
Smog Bothers Pedestrians, Los Angeles (1950s) Hollywood Citizens News Collection, Los Angeles Public Library
How Many People Die From Ambient Air Pollution? Ozone-related mortality PM2.5-related mortality(*) 470,000 (95% CI: 140,000 - 900,000) 2.1 million (95% CI: 1.3 - 3.0 million) (*) PM2.5 calculated as a sum of species (dark blue) PM2.5 as reported by 4 models (dark green) Light-colored bars - low-concentration threshold (5.8 µg m-3) Silva et al. (2013)
Global Burden: Ozone-related mortality Global and regional mortality per year Respiratory mortality , deaths yr-1 (1000 km2)-1, multi-model mean in each grid cell , 14 models (*) Exposed population (age 30 and older) Silva et al. (2013)
Global Burden: PM2.5-related mortality Global and regional mortality per year 1 CPD+LC mortality , deaths yr-1 (1000 km2)-1, multi-model mean in each grid cell , 6 models (*) Exposed population (age 30 and older) Silva et al. (2013)
Global burden of disease of outdoor air pollution WHO GBD 2010 3.2 million deaths per year (95% CI:2.8 – 3.6 million) Lim et al., 2012
Connections Between Air Pollution and Climate Change • Several air pollutants affect climate • Ozone (O3) is a greenhouse gas (GHG) • Aerosols scatter and absorb sunlight, and affect clouds. • Changes in climate may affect air quality (of O3, PM, or other pollutants). • Sources of air pollutants and GHGs are shared – fossil fuel combustion. • Climate change may influence demands for energy, and therefore emissions.
Air pollution Sources & Policies Air pollutants Human Health Climate Change GHGs Connections Between Air Pollution and Climate Change Emissions Problems Impacts 1 3 2 4 Big Question: How can we plan to address air pollution and climate change in a coordinated way?
Radiative Forcing 1750-2005 IPCC, 2007
Ozone Precursors Affect Both Ozone Air Quality and Climate Forcing Global Urban hn hn O3 O3 NO NO NO2 NO2 HO2 HO2 OH OH NMVOCs, CO, CH4 NMVOCs, CO
Ozone Precursors – Effects on Climate -20% NMVOC -20% NOx -20% CO Global Warming Potential (GWPH ): RF integrated to time horizon, H, following 1-year pulse emission: ∫H RFNOx /D emissions / ∫H RFCO2/D emissions Patterns of GWP100 similar to normalized net RFs [Fry et al., JGR, 2012]
CO as Kyoto’s Forgotten Gas Using methods from Fry et al. [2012] andCollins et al. [2013] 4.07 [3.71 to 4.37] All regional GWP20 within 8.8% of Global GWP20 O3 + CH4 20-yr GWP O3 + SO42- 1.34 [1.26 to 1.44] All regional GWP100 within 7.5% of Global GWP100 100-yr GWP [Fry et al., ACP, 2013]
Ozone Precursors Affect Both Ozone Air Quality and Climate Forcing Global Urban hn hn O3 O3 NO NO NO2 NO2 HO2 HO2 OH OH NMVOCs, CO, CH4 NMVOCs, CO
Annual Average Simulate a 20% Reduction of Global Methane Change in surface 8-hr. ozone from a 65 Mton CH4 yr-1 reduction in methane emissions, at steady state (81% achieved by 2030 if implemented in 2010). Jun-Jul-Aug Global annual average ozone (ppb) A2 Anthrop. emissions 2000-2030: CH4 +48%, NOX +70%
2030 Avoided Premature Deaths20% Global Methane Emissions Reduction Total 2030 avoided deaths: 30,200 West et al. (2006) PNAS
Comparing Monetized Health Benefits with Control Costs • ~10% of anthropogenic methane emissions can be reduced at a cost-savings. • Marginal cost of reducing 65 Mton CH4 yr-1 (20%) is ~$100 per ton CH4 (total cost is negative, IEA (2003)). • Marginal cost-effectiveness is $420,000 per avoided death for the 20% reduction. • Benefit is ~$240 per ton methane reduced(~$12 per ton CO2 equivalent) when deaths are valuedat $1 million each. • Health benefits can exceed the costs of the 20% methane reduction. • Methane mitigation can be a cost-effective tool for global and decadal ozone management. West et al. (2006) PNAS
Co-benefits - Background Reducing GHG emissions also reduces co-emitted air pollutants • Air quality and health co-benefits shown to be substantial compared to GHG abatement costs. “$2-175 / ton CO2 … all studies agree that monetized health benefits make up a substantial fraction of mitigation costs.” IPCC AR4 “$2-196 / ton CO2, and the highest co-benefits found in developing countries. These values, although of a similar order of magnitude to abatement cost estimates, are only rarely included in integrated assessments of climate policy.” Nemet et al. (2010) • Most studies have focused locally or regionally. • Tend not to analyze future scenarios. • None has been global, using an atmospheric model.
Sources & Policies Air pollutants Human Health Air pollution Climate Change GHGs Co-benefits of GHG Mitigation for Air Quality 1) Immediate and Local 2) Long-Term and Global Objective: Analyze global co-benefits for air quality and human health via both mechanisms, in scenarios to 2100.
Results – PM2.5 Concentration Global population-weighted, annual average PM2.5
Results – PM2.5 Concentration Annual average PM2.5 Total change RCP4.5 - REF Meteorology eREFm45 - REF Emissions RCP4.5 – eREFm45 2050 2100
Results – Ozone Concentration Global population-weighted, max. 6 month average of 1 hr. daily max ozone
Results – Ozone Concentration Max. 6 month average of 1 hr. daily max ozone Total change RCP4.5 - REF Emissions RCP4.5 - eREFm45 Meteorology eREFm45 - REF 2050 #2 Meteorology Total co-benefit #1 Emissions 2100
Results – Global Premature Mortality Projection of global population and baseline mortality rates from International Futures. PM2.5 co-benefits (CPD + lung cancer mortality) 2030: 0.4±0.2 2050: 1.1±0.5 2100: 1.5±0.6 Ozone co-benefits (respiratory mortality) 2030: 0.09±0.06 2050: 0.2±0.1 2100: 0.7±0.05
Results – Valuation of Avoided Mortality Red: High valuation (2030 global mean $3.6 million) Blue: Low valuation (2030 global mean $1.2 million) Green: Median and range of global C price (13 models)
Monetized Co-benefits Global average: $50-380 / ton CO2 US and Western Europe: $30-600 / ton CO2 China: $70-840 / ton CO2 India: -$20-400 / ton CO2 Higher than previous estimates: $2-196 / ton CO2 - Use future scenarios where population, susceptibility to air pollution, and economies grow. - Account for chronic mortality influences of ozone as well as PM2.5. - Account for global transport, and long-term influences via methane.
Major uncertainties Only adults >30 years accounted for. (low bias) Co-benefits of GHG mitigation would be greater had the reference scenario not assumed decreased air pollution. RCP emissions do not include primary inorganics (fly ash). (low bias for PM2.5) Coarse grid resolution for air pollution exposure. (low bias for PM2.5) Applying concentration-response functions from the present-day US, globally and into the future. Alternative approach: value as avoided air pollution control costs.
Co-benefits: conclusions Global abatement of GHG emissions brings substantial air quality and human health co-benefits. Global GHG mitigation (RCP4.5 relative to REF) causes 0.5±0.2 million avoided deaths in 2030, 1.3±0.5 in 2050, and 2.2±0.8 in 2100 Global average monetized co-benefits are $50-380 / ton CO2 Greater than previous estimates Greater than abatement costs in 2030 and 2050. The direct co-benefits from air pollutant emission reductions exceed those via slowing climate change.