Download
1 / 21
210 likes | 394 Vues
U.S. Department of Health and Human Services Centers for Disease Control and Prevention National Center for Health Statistics National Vital Statistics System. Characteristics of Births by State: A New NCHS Report. Paul D. Sutton, Ph.D.; and T.J. Mathews, M.S. Annual Reports

E N D
U.S. Department of Health and Human Services Centers for Disease Control and Prevention National Center for Health Statistics National Vital Statistics System Characteristics of Births by State: A New NCHS Report Paul D. Sutton, Ph.D.; and T.J. Mathews, M.S.
Annual Reports Annual Volumes (VSUS) Series Reports Public Use Micro Data Files Sources of State Data SOURCE: National Vital Statistics System, NCHS, CDC
Some of the People Interested in State Data • Researchers • Policymakers • News Media • Public SOURCE: National Vital Statistics System, NCHS, CDC
In print (copies are available at NCHS booth and here after the presentation) On the Internet at www.cdc.gov/nchs Trends in Characteristics of Births by State: United States, 1990, 1995, and 2000-2002 SOURCE: National Vital Statistics System, NCHS, CDC
Topics Births Birth Rates Fertility Rates First Birth Rates Sex Ratio Marital Status Educational Attainment Detail Race and Hispanic origin Non-Hispanic white Non-Hispanic black American Indian Asian or Pacific Islander Hispanic For 1990, 1995, and 2000-2002 Of course by State Topics and Detail Covered in the Report SOURCE: National Vital Statistics System, NCHS, CDC
Presentation of Data Detailed Tables Graphs Maps SOURCE: National Vital Statistics System, NCHS, CDC
Percent change in number of births between 1990 and 2002 by State SOURCE: National Vital Statistics System, NCHS, CDC
Lowest Lowest Highest Highest 48.9 Vermont 64.8 U.S. 90.6 Utah Birth and Fertility Rates: United States, 2002 • Crude birth rates(births per 1,000 total population) • Fertility rates(births per 1,000 women age 15-44 years) 10.4 Vermont 13.9 U.S. 21.2 Utah SOURCE: National Vital Statistics System, NCHS, CDC
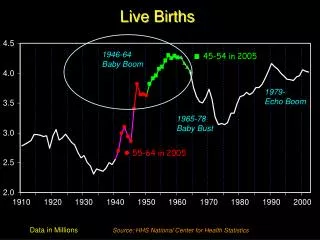
Age-specific birth rates: United States, 1990 and 2002 SOURCE: National Vital Statistics System, NCHS, CDC
Total fertility rates by State, 2002 SOURCE: National Vital Statistics System, NCHS, CDC
Median age of mother at first birth, 2002 SOURCE: National Vital Statistics System, NCHS, CDC
Total Births Expected: United States,1995 SOURCE: Abma J, Chandra A, Mosher W, Peterson L, Piccinino L. Fertility, family planning, and women’s health: New data from the 1995 National Survey of Family Growth. National Center for Health Statistics. Vital Health Stat 23(19). 1997. SOURCE: National Vital Statistics System, NCHS, CDC
Fertility rate: United States, 1990 and 2002 SOURCE: National Vital Statistics System, NCHS, CDC
Standardized total fertility rates by State, 2002 SOURCE: National Vital Statistics System, NCHS, CDC
Other Topics in the Report • Sex Ratios • First Birth Rates • Educational Attainment • Percentage Unmarried SOURCE: National Vital Statistics System, NCHS, CDC
Percentage of births to mothers with 16+ years of education: United States, 1990 and 2002 SOURCE: National Vital Statistics System, NCHS, CDC
Arizona • Colorado • Delaware • Iowa • Kansas • Minnesota • Nebraska • Nevada • New Mexico • South Dakota • Utah • Washington Education Attainment: 1990-2002 • Nationally the percent with 16+ years of education increased and the percentage of women with <12 years of education fell. • The majority of States followed the national pattern, however 12 States had significant increases in the percentage of mothers with < 12 years of education. SOURCE: National Vital Statistics System, NCHS, CDC
Births to Unmarried Women: 1990-2002 • Nationally the proportion of births to unmarried mothers increased from 28 to 34 percent. • The proportion of births to unmarried women varies widely by race and ethnicity of mother. SOURCE: National Vital Statistics System, NCHS, CDC
Percent unmarried by State, 2002 SOURCE: National Vital Statistics System, NCHS, CDC
Summary of Findings • Differences in fertility by State exist even after taking into account the effect of age and race • Despite near universal increases in the percentage of women with 16+ years of education by State, nearly ¼ of the States are seeing a simultaneous increase in the percentage of women with <12 years of education • The proportion of births to unmarried mothers has increased for the United States and for every State between 1990 and 2002 SOURCE: National Vital Statistics System, NCHS, CDC
For more information contact: Paul Sutton PSutton@cdc.gov - or - TJ Mathews TMathews@cdc.gov SOURCE: National Vital Statistics System, NCHS, CDC