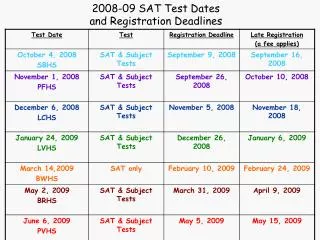
Download
1 / 56
560 likes | 682 Vues
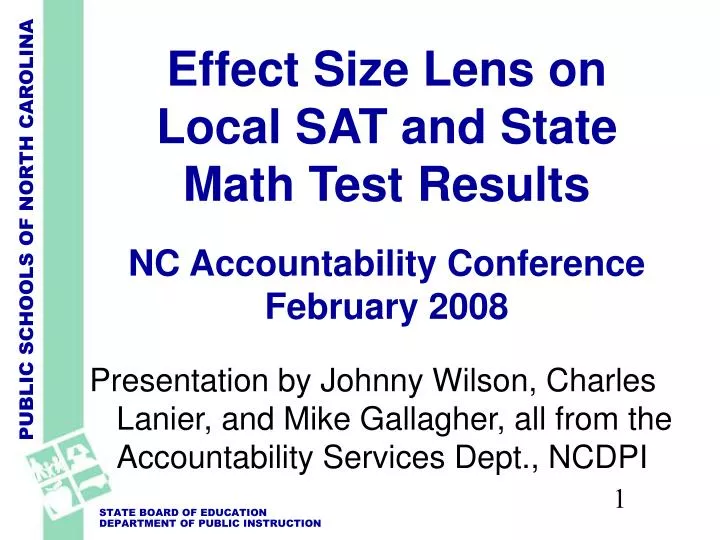
Effect Size Lens on Local SAT and State Math Test Results NC Accountability Conference February 2008. Presentation by Johnny Wilson, Charles Lanier, and Mike Gallagher, all from the Accountability Services Dept., NCDPI. Purposes – Overall Session.

E N D
Effect Size Lens on Local SAT and State Math Test Results NCAccountability ConferenceFebruary 2008 • Presentation by Johnny Wilson, Charles Lanier, and Mike Gallagher, all from the Accountability Services Dept., NCDPI
Purposes – Overall Session • Provide background and access paths to important data. (important = helpful) • Show how LEAs and schools can access and compare test results across EOG, EOC and SAT. • Entice folks to exploit the usefulness of such comparisons.
Who’s on First? • Johnny Wilson, Reporting Section, SAT Data Report. jwilson@dpi.state.nc.us • Charles Lanier, Test Development Section, State Testing Data in the Green Book. clanier@dpi.state.nc.us • Mike Gallagher, Test Development, Effect Size Look at SAT and State Test Results. mgallagher@dpi.state.nc.us
Purposes – Part 1: SAT • Get acquainted with the major trends in SAT results for North Carolina. • Look at school level variability of SAT results from year-to-year. • Show the access path for information at the school and LEA levels.
SAT Math Score Trends Between 1997 and 2007, the Math gap between NC and the Nation narrowed from 23 pts. to 6 pts. NC’s Math scores fell in 2007 after more than a decade of gains.
SAT Verbal Score Trends By comparison, NC’s Verbal scores have been up and down over the same period. Between 1997 and 2007, the Math gap between NC and the Nation has narrowed from 15 pts. to 7 pts.
SAT Total Score Trends for NC and the Nation • After 10 consecutive years of gains, • NC’s mean total SAT scores fell in • 2006 and 2007. • Gap between NC’s mean total score • and the nation’s score has narrowed • from 53 in 1990 to 13 points in • 2007.
NC’s Schools with Declining SAT Scores At the school level, math scores also declined in 2006 & 2007, compared with the previous year. Notably, fewer schools increased math scores in 2007 than in 2006.
Changes in SAT Math Scores Most changes in SAT scores from year to year are not unusual. Low-Volume Schools tend to have larger changes. The larger the test-taking population, the smaller changes in SAT scores tend to be.
Factors that Might Influence Score Fluctuations Fatigue Factor SAT fee increase in 2005 resulted in decline in repeat test-takers. Difficulty of the test
NC’s Asian students had the highest SAT score among racial/ethnic groups, followed by White students. Only Asian and White students scored above the state average. NC SAT Math Scores by Race
NC SAT Math Scores by Race Mean SAT Score
SAT Mathematics Scores By Race/Gender Mean SAT Score
For More Information . . . SAT Reports from 1995 to 2007 include information and data for: the Nation the State 117 Public School Systems Charter Schools North Carolina School of the Arts North Carolina School of Science and Mathematics http://www.ncpublicschools.org/accountability/reporting/sat/
Sample SAT Report Page • Some questions to explore: • Are districts closer to the state average in Math than in Critical Reading? • How about variability among schools within districts? • How about participation rates?
Question of the Day … • SAT puts an “official” question of the day on its web site. • Excellent way to get a better understanding of what students will be facing. Why not have 8th graders try them? • www.collegeboard.com
Purposes – Part 2: Green Book • Find out more about getting data from the Green Book, … • both in its standard form … • and its interactive, electronic form.
Electronic GreenBookhttp://report.ncsu.edu/ncpublicschools • Equally accurate • Equally reliable • More timely • More accessible
year students subject grade geography display Electronic GreenBookhttp://report.ncsu.edu/ncpublicschools
Electronic GreenBookhttp://report.ncsu.edu/ncpublicschools 1. participation 2. performance
year geography grade & subject students Electronic GreenBookhttp://report.ncsu.edu/ncpublicschools
Electronic GreenBookhttp://report.ncsu.edu/ncpublicschools So far … • Questions? • Answers? • 5% / 95% Rule
Classic Green Book • SAMPLE PAGES FOLLOWING ….. • Finding average scale scores for LEAs. • Finding standard deviations for EOC and EOG scale scores. • ….. Which leads in to … PART 3
Purposes – Part 3: THE LENS • Discuss effect size, a useful tool for a fuller understanding of LEA or school performance across grade and time. • Compute some math effect sizes and highlight where the information is obtained. • Show the relationship between LEA math performance on SAT, EOC, and EOG.
The Importance of “Where.” • ‘A school (or LEA) is data driven wise if everyone knows where they are and where they are going.” • … Donna Snodgrass, et al.
Where is this LEA? • Math ABC Results for 2006-2007 • (Percent at or above grade level) • EOG Grade 5 ….. 59.8 (state 66.7) • EOG Grade 8 ….. 48.9 (state 65.1) • EOC Geometry …45.0 (state 63.0) • Pass rates and gaps in pass rates leave out a big part of the picture.
The Average is above Average • The percent above a cut score counts a score the same whether it is just above (below) the cut or far above (below) the cut. BUT the average includes all the score information. • Year-to-year changes in percent above are affected by where on the distribution the cut is located. BUT the average follows the center of scores.