Download
1 / 27
270 likes | 360 Vues
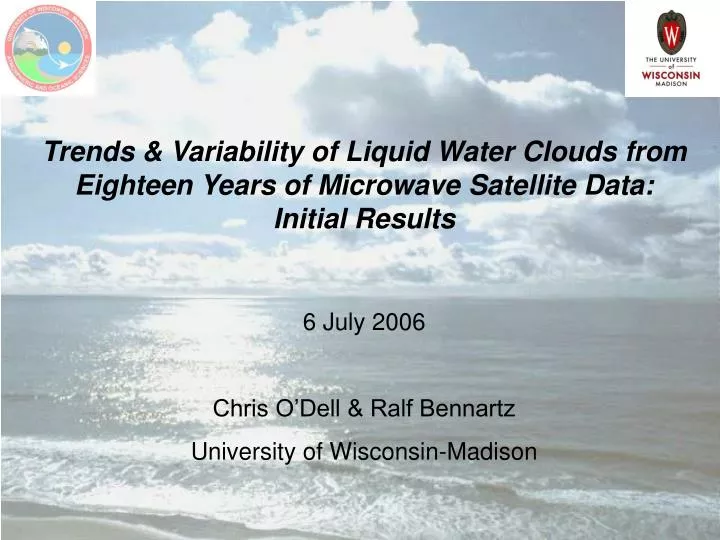
Trends & Variability of Liquid Water Clouds from Eighteen Years of Microwave Satellite Data: Initial Results 6 July 2006 Chris O’Dell & Ralf Bennartz University of Wisconsin-Madison. Talk Outline. Motivation Description of sensors & retrieval product

E N D
Trends & Variability of Liquid Water Clouds from Eighteen Years of Microwave Satellite Data: Initial Results 6 July 2006 Chris O’Dell & Ralf Bennartz University of Wisconsin-Madison
Talk Outline • Motivation • Description of sensors & retrieval product • Mean climatology & comparison with ERA40, ISCCP • Diurnal cycle • Long-term trends?
Motivation for a cloud liquid water path (LWP) climatology • Anthropogenic trends in cloud properties are possible, due both to global warming and aerosol effects. • A robust LWP climatology can serve as a benchmark for global climate models. • The 18-year passive microwave record contains a robust and independent measure of liquid clouds.
Previous successes from passive microwaves: • Increases in lower tropospheric temperature, decreases in stratospheric temperatures from Microwave Sounding Unit (Mears et al. 2003, Christy et al. 2003, Vinnikov & Grody 2003) • Increases in global (especially northern hemisphere) water vapor path (Trenberth et al., 2005)
Microwave sensors measuring LWP All instruments are conical scanners, with footprints ~ 40 km
Calibration/Retrieval • All satellites have been intercalibrated – the radiances are consistent from one satellite to the next (RSS, unpublished!) • All satellites use the same, modern retrieval algorithm to simultaneously retrieve LWP, water vapor path, and surface wind speed. • Probably better than older algorithms which often used 2 channels to retrieve a given quantity, algorithms tended to be regression-based, and tended to retrieve different quantities independently.
No global trend with simple average! LWP Agreement between sensors is good
Processing Scheme At Remote Sensing Systems • Retrieved LWP binned daily onto a 0.25º grid (1440x720) for both morning & evening overpasses • Even pixels with heavy rain retrieve LWP (but not water vapor or surface winds) At Wisconsin • Quantities further binned to 2.5º grid, monthly average for each sensor & local overpass time. • Monthly diurnal cycle fits made for each pixel (average of all years). • Diurnally-corrected monthly means calculated for each pixel. • Seasonal & annual LWP trends calculated for each pixel.
Problem in Sc regions! Does microwave LWP agree with ERA40?
Problems at higher latitudes Ice? Does microwave LWP agree with ISCCP*? * ISCCP D3 water path (WP)
Diurnal Cycle Fitting • Goal is to make a diurnally-corrected LWP climatology • Previous work with TRMM only retrieved diurnal cycle for tropics. Possible midlatitude diurnal cycle? • For each 2.5º pixel & month, fit local time versus LWP to this function: • ( corresponds to 24 hours) • Use resultant fits to correct each monthly binned observation.
F11 F13 F15 F14 SSM/I LWP Diurnal Cycle Strength TRMM-TMI Wood et al., Geophysical Research Letters, 29 (23), 2002
Normalized Diurnal Amplitude Liquid Water Path [kg/m2] Local Time [hours]
Liquid Water Path [kg/m2] Local Time [hours]
Liquid Water Path [kg/m2] Local Time [hours]
Liquid Water Path [kg/m2] Local Time [hours]
Liquid Water Path [kg/m2] Local Time [hours]
Liquid Water Path [kg/m2] Local Time [hours]
Conclusions • Existing passive microwave observatinos appear to provide a stable, long-term record for climate studies of liquid clouds. • ERA40’s cloud parameterization seems to poorly characterize LWP seasonal and interannual variability in the subtropical high stratocumulus regions. • The diurnal cycle of LWP has been well-characterized in most ocean locations, and is generally in agreement with previous studies. • Initial studies of LWP trends are promising, with hints of regional trends (especially in the northern high latitudes), but no significant long-term global trend.
“To Do List” • Principle component analysis - may reveal interesting patterns of variability or problems with the data set. • Further investigation of the derived diurnal cycles – how constant are they from year-to-year? How well do they compare with CA & precip diurnal cycles? • More sophisticated statistical analyses of LWP trends…(hint to audience for guidance) • Make the complete LWP climatology available on the web.