Download
1 / 20
210 likes | 366 Vues
Communication of Statistics . Maja Andreevska Director, Statistics Department National bank of the Republic of Macedonia E-mail: AndreevskaM@nbrm.mk. Outline. Why now? What is in the theory? Perceptions by the public The impact of good communication practices

E N D
Communication of Statistics Maja Andreevska Director, Statistics Department National bank of the Republic of Macedonia E-mail: AndreevskaM@nbrm.mk
Outline Why now? What is in the theory? Perceptions by the public The impact of good communication practices How to measure whether communication is adequate? Current practices at the NBRM Latest activities Future plans
Why now? “...the crisis has demonstrated a need to improve the communication of official statistics and advance the interaction among the academic, policy and statistical communities.” (The G-20 Report on Financial Crisis and Information Gaps) Recommendations G-20 Data Gaps Initiative (DGI): “There is also a need to improve the communication of official statistics, as in some instances users were not fully aware of the available data series to address critical policy issues.” the Principal Global Indicators website http://www.principalglobalindicators.org/default.aspx) to promote comparable data sets for the real, financial, government and external sectors of the G-20 economies, and economies with systemically important financial sectors
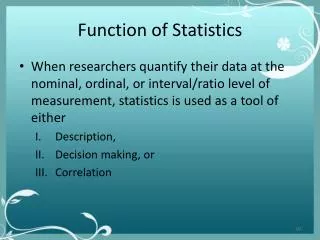
What is in the theory? Main components of the communication process1 The transmitter. – the statisticians The receiver – the “audience.”, generally divided five categories, (a) experts, (b) politicians and policy makers, (b) students, (c) statistical data users, (d) not specialized. The channel – auditory (“listening” explanation), visual (“looking”), and kinetic “doing”, requiring practical exercises) The message – the statistics – data, comments, methodologies Code – the outline, the tools and the cloths Context - situation or occasion Feedback – possibility to adjust to receiver’s needs Noise - elements disturbing the communication 1For details, see Maggino, Prof. Filomena and Trapani, Dr. Marco (2009) Presenting and communicating statistics: principles, components, and their quality assessment: a proposal. In Proceedings NTTS, New Techniques and Technologies for Statistics, pages pp. 47-56, Brussels, European Commission, EUROSTAT.
Perception by the public - 1 Statistics is a necessary evil and best left to those bent that way – just give us the numbers! necessary analytical tool bombarding with too many mind-numbing numbers expert users and occasional users struggle to navigate their way through the multiple places in which statistics are published good statistics should underpin all public policy statistical writing can bring data to life, making it real, relevant and meaningful to the audience
Perception by the public - 2 Are we trustworthy? – Does the public believe the institution DQAF – Data Quality Dimensions Integrity – Professionalism, Transparency Methodological Soundness Accuracy and reliability –Data Sources, Data Revisions Serviceability – Periodicity, Timeliness, Consistency Accessibility – of Data and Metadata, Assistance to Users Basic principles in the Code of Practice of the European Statistics Principle 15: Accessibility and Clarity We can succeed in convincing the public that we are trustworthy, only if they believe that we are meeting all or most of the above criteria
The Impact of Good Communication Practices Increase public awareness of economic developments and provide relevant information for potential users Transparent disclosure of statistical information used for monetary policy decisions, available also to the general public, can increase the recognition of sound economic policies and evidence-based decision making by policy makers Comprehensive and timely statistics can be basis of analysis for scientific purposes, as well as for specific targeted analysis of corporations, as well as for political debate Regular and timely information from credible statistical producers can affect markets and influence overall stability
Measuring whether communication is adequate Self assessment activities Analysis of communication practices of other statistical producers Undertaking studies on particular aspects of communication (ex. House of Commons Public Administration Select Committee “Communicating statistics: Not just true but also fair http://www.parliament.uk/pasc) Organizing surveys on certain aspects of communicating statistics – receiving feedback from the users Receiving feedback on a daily basis - establishing channels for regular communication with the users – 24h open telephone line (ex. Statistics Hotline – OeNB), User Support e-mail address
Current practices at the NBRM • Advance Release Calendar • Immediate update of new data releases on NBRM’s home page • All data series available in .xls format • All data backed by Methodological explanations documents, regularly updated • User Support e-mail address contact.statistika@nbrm.mk accessible through NBRM’s website • Internal DMS application ST service desk – for internal users‘ ad hoc requests • No availability of a Statistical Data Warehouse or any search engines for users • No possibility for users to use or create graphical presentations on the NBRM website • No regular statistical press releases on the areas of statistics produced by the NBRM • No possibility for interaction with users such as subscription of users
Latest activities - 1 Strategic goals 2013-2015 – meeting users requirements in the area of statistics Initiating activities for improving the IT infrastructure for statistics – establishing a Statistical Data Warehouse Organizing a survey to measure the satisfaction of users and reporters – preparations started late 2012, survey conveyed June 2013 Preparing and presenting a special report for the NBRM management on the feedback of users and reporters Setting up an Action plan for further steps to be taken
Latest activities -2 Survey on Data Users Population – 674 users from our list – response rate 35% The survey was completely anonymous. Respondents were encouraged to provide honest replies Questions segmented in five areas: accessibility of the web site of NBRM in the area of statistics; users’ habits in using data – purpose, frequency, computer literacy; data quality – scope, format, timeliness of data and metadata, confidentiality, responsiveness of the NBRM to ad-hoc requests professionalism of staff within the Statistics Department demographics For most questions - answers with grading – degrees of satisfaction 1-5 Some of the questions, where applicable, provided space to leave a comment, make suggestions for improvement, make remarks or criticize
Results from the Survey on Data Users Respondents in general expressed satisfaction with statistics produced by the NBRM, in all of the quality dimensions for which feedback was required Analysis of the replies to questions that had answers with grading, shows the average ratings are from 3.9 to 4.4 data quality – scope, format, timeliness of data and metadata – grade 3.9, confidentiality – 4.4, overall data quality – 4.0 professionalism of staff within the Statistics Department – 4.2 Respondents have widely used the possibility to leave comments, make suggestions for improvement
Latest activities -3 Survey on Data Reporters Population – 2400 reporters from our registers – response rate 25% The survey was completely anonymous. Respondents were encouraged to provide honest replies Questions segmented in four areas: accessibility of the NBRM website in the area of statistical reporting requirements; manner of reporting– electronic reporting, paper forms, reporting instructions, training of reporters, reporting deadlines, confidentiality professionalism of staff within the Statistics Department demographics For most questions - answers with grading – degrees of satisfaction 1-5 Some of the questions, where applicable, provided space to leave a comment, make suggestions for improvement, make remarks or criticize
Results from the Survey on Data Reporters Respondents in general expressed satisfaction with the process of reporting statistical data to the NBRM, in all of the aspects of reporting for which feedback was required Analysis of the replies to questions that had answers with grading, shows the average ratings are from 4.0 to 4.6 manner of reporting– electronic reporting – 4.2, paper forms reporting – 4.2, reporting instructions – 4.0, training of reporters – 4.5, reporting deadlines - 4.3, confidentiality – 4.6 professionalism of staff within the Statistics Department – 4.4 Respondents have widely used the possibility to leave comments, make suggestions for improvement
Conclusions The NBRM is constantly playing the role of an intermediary among users requirements on one hand and reporters possibilities and willingness to report data on the other hand. Some of the results and comments in both surveys show that this can be a very challenging task The results of the surveys, and in particular some of the comments have been basis for the construction of an Action plan to be presented to the management and implemented within our work program, such as: Establishing a Statistical Data Warehouse and search engines for data users Improving methodological presentations Adjustment in reporting deadlines, changes in reporting instructions – where applicable Improving applications for electronic reporting Providing list of contact officers for data users and data reporters on the website