Download
1 / 70
700 likes | 828 Vues
Module 5.1. Mitigation Methods and Tools in the Energy Sector. Purpose of this Module. To introduce different approaches for GHG mitigation assessment in the energy sector. To review the benefits and drawbacks of different approaches.

E N D
Module 5.1 Mitigation Methods and Tools in the Energy Sector
Purpose of this Module • To introduce different approaches for GHG mitigation assessment in the energy sector. • To review the benefits and drawbacks of different approaches. • To introduce various software tools that may be useful for GHG mitigation analysis. • To provide participants with information to help them choose an appropriate tool for their own assessments. • NB: will NOT provide in-depth training in the use of any one tool. • Separate, in-depth training will be likely required for any tools selected.
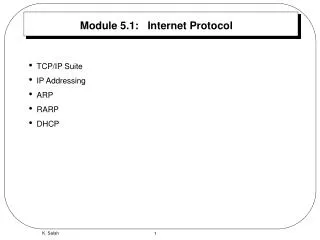
Module 5.1: Energy Sector Mitigation Methods • Approaches for Energy Sector Mitigation Modeling • Review of Modeling Tools • MARKAL • ENPEP-BALANCE • LEAP • RETScreen • Conclusions
Module 5.1 a) Approaches for Energy Sector Mitigation Modeling
Some Background… • Decision 17/CP.8, para 38: • Based on national circumstances, NA1 Parties are encouraged to use whatever methods are available and appropriate …
Top-down Use aggregated economic data Assess costs/benefits through impact on output, income, GDP Implicitly capture administrative, implementation and other costs. Typically assume efficient markets, and no “efficiency gap” Capture intersectoral feedbacks and interactions Commonly used to assess impact of carbon taxes and fiscal policies Less suitable for examining technology-specific policies. Bottom-up Use detailed data on fuels, technologies and policies Assess costs/benefits of individual technologies and policies Can explicitly include administration and program costs Don’t assume efficient markets, overcoming market barriers can offer cost-effective energy savings Capture interactions among projects and policies Commonly used to assess costs and benefits of projects and programs Approaches for Energy Sector Mitigation Assessment
Top-Down Assessments (1) • Examine general impact on economy of GHG mitigation. • Important where GHG mitigation activities will cause substantial changes to an economy. • Typically examine variables such as GDP, employment, imports, exports, public finances, etc. • Assume competitive equilibrium and optimizing behavior in consumers and producers. • Should also consider role of informal sector, which may be important in many non-Annex 1 countries. • Can be used in conjunction with bottom-up approaches to help check consistency. • E.g. energy sector investment requirements from a bottom-up energy model used in macroeconomic assessment to iteratively check the GDP forecasts driving the energy model.
Top-Down Assessments (2) • Types of top-down approaches: • Simplified macroeconomic assessment: seeks consistency between sectoral forecasts and informs baseline scenarios. • Input-output: captures intersectoral feedbacks but not structural changes in economies (assume no shifts between sectors). • Computable general equilibrium: captures structural changes, assume market clearing. • 2 & 3 require more expertise and more data, which may not be available in many non-Annex 1 countries. • All models are abstractions. Assumptions may not reflect real-world market conditions. • Macroeconomic models tend to be country-specific. Off-the-shelf software not typically available.
Bottom-Up Models (Energy Sector) • Optimization Models e.g. MARKAL • Iterative Equilibrium/Simulation Models e.g. ENPEP-BALANCE • Hybrid Modelse.g. MARKAL-MACRO • Accounting Frameworks e.g. LEAP
Models for Mitigation Analysis in the UNFCCC Context • UNFCCC Guidelines do not specify which approach is appropriate for national communications on mitigation. • Both Top-Down and Bottom-up models can yield useful insights on mitigation. • Top-down models are most useful for studying broad macroeconomic and fiscal policies for mitigation such as carbon or other environmental taxes. • Bottom-up models are most useful for studying options that have specific sectoral and technological implications. • The lack of off-the-shelf top-down models, the greater availability of physical, sectoral and technological data, and the focus on identifying potential projects has meant that most mitigation modeling has so far focused on bottom-up approaches.
Module 5.1b Types of Bottom-Up Models
Optimization Models • Use mathematical programming to identify configurations of energy systems that minimize the total cost of providing energy services. • Cost-minimization is performed within constraints (e.g. limits on CO2 emissions, technology availability, foreign exchange, etc.). Constraints also ensure balance of supply and demand. • May optimize over all time periods (perfect foresight) or year-on-year (myopic). • Select among technologies based on their relative costs. • Dual solution yields estimates of energy prices. • Can yield extreme “knife edge” solutions (model allocates all market share to cheapest technology – even if only slightly cheaper) • Must be constrained to yield “reasonable” results: by using “hurdle” rates, by disaggregating demands into homogenous groups, or by constraining market allocations. • Typically assume perfect competition/energy cost is only factor in technology choice. • Useful where complex options need to be analyzed and costs are well known. • Cost-minimization assumptions may be inappropriate for simulating “most likely” evolution of real-world energy systems in a baseline scenario. • Data intensive • Complex so hard to apply where expertise is limited. • Examples: MARKAL/TIMES
Iterative Equilibrium/Simulation Models • Simulate behavior of energy consumers and producers under various signals (e.g. price, income levels) and constraints (e.g. limits on rate of stock replacement). • Easier to include non-price factors in analysis compared to optimizing models. • Balances demand and supply by calculating market-clearing prices. • Prices and quantities are adjusted endogenously using iterative calculations to seek equilibrium prices. • Behavioral relationships can be controversial and hard to parameterize. Crucial parameters are highly abstracted or poorly known, especially in countries where time series data is lacking. • Example: ENPEP-BALANCE
Hybrid Models • Examines macroeconomic impacts of energy system on the wider economy. • Changes in the energy system can feed-back to effect macroeconomic growth and structure. • Production functions allow for substitution among capital, labor and different forms of energy. • Useful energy demands are endogenous to the model. • Example: MARKAL-MACRO
Accounting Frameworks • Account for flows of energy in a system based on simple engineering relationships (e.g. conservation of energy). • Rather than simulating decisions of energy consumers and producers, user explicitly accounts for outcomes of those decisions. • Simple, transparent, intuitive & easy to parameterize. • Evaluation and comparison of policies are largely performed externally by the analyst: framework serves primarily as a sophisticated calculator/database/reporting tool. • Framework ensures physical consistency but not economic consistency. • Example: LEAP
Module 5.1c Review of Modeling Tools
Criteria for Inclusion of Tools in this Review Tools must be: • widely applied in a variety of international settings, • thoroughly tested and generally found to be credible, • actively being developed and professionally supported, • primarily designed for integrated energy and GHG mitigation analysis, or screening of energy sector technologies.
Included Tools • LEAP • Long-range Energy Alternatives Planning system • Primary Developer: Stockholm Environment Institute • ENPEP • Energy and Power Evaluation Program • Primary Developers: Argonne National Laboratory and the International Atomic Energy Authority (IAEA) • MARKAL and MARKAL-MACRO • MARKet Allocation model • Primary Developers: IEA/ETSAP • RETSCREEN • Renewable Energy Technology Screening • Primary Developers: Natural Resources Canada • All are integrated scenario modeling tools except RETSCREEN, which screens renewable and CHP technologies. • Other tools and approaches may be appropriate. • Full Disclosure: Dr. Heaps is the developer of LEAP: reviewed here.
Module 5.1d MARKAL
MARKAL and MARKAL-MACRO • Developed International Energy Agency, Energy Technology Systems Analysis Programme (IEA/ETSAP). • Generates energy, economic, engineering, and environmental equilibrium models. • Models are represented as Reference Energy Systems (RES), which describe an entire energy system from resource extraction, through energy transformation and end-use devices, to the demand for useful energy services. • Calculates the quantity and prices of each commodity that maximize either the utility (MARKAL-MACRO) or the producer/consumer surplus (MARKAL) over the planning horizon, thereby minimizing totally energy system cost. • Note: TIMES: “The Integrated MARKAL-EFOM System” is gradually expected to replace MARKAL and MARKAL-MACRO.
What Does MARKAL Do? • Identifies least-cost solutions for energy system planning. • Evaluates options within the context of the entire energy/materials system by: • balancing all supply/demand requirements, • ensuring proper process/operation, • monitoring capital stock turnover, and • adhering to any environmental & policy constraints. • Selects technologies based on life-cycle costs of alternatives. • Provides estimates of: • energy/material prices; • demand activity; • technology and fuel mixes; • marginal value of individual technologies to the energy system; • GHG and other emission levels, and • mitigation and control costs.
What Aspects of Mitigation Assessment Can MARKAL Support? • Macroeconomic policies (e.g. carbon taxes) • Transportation • Energy demand • Energy conversion and supply • Energy sector emissions • Non-energy sector industrial process emissions • Solid waste management • Geological sequestration • Value of carbon rights
MARKAL-MACRO • MARKAL-MACRO (M-M) is an extension of the MARKAL model that simultaneously solves the energy and economic systems. • Can be thought of as a hybrid model as merges elements of top-down and bottom-up analysis. • Has price responsive demands (i.e., determined endogenously) while MARKAL does not (i.e., demands are exogenously defined). • Maximizes consumer welfare over the solution period, optimizes aggregate investment in the economy and provides least cost energy system configurations to meet endogenously determined demands. • Energy service costs, energy service demands, and energy prices are determined simultaneously during optimization. • Relative energy costs determine types and levels of substitution between fuels and technologies.
MARKAL Requirements • Windows PC with 512 MB RAM. • MARKAL/TIMES source code (written in GAMS) • GAMS modeling language and a Solver • Data Management and Reporting User Interface • Two available: ANSWER and VEDA • Cost of software: US $8,500-$15,000 depending on institutional arrangements.
MARKAL Applications • International Energy Agency (IEA): technology detail for the World Energy Outlook scenarios. • U.S. DOE/SAGE: an analytic framework for the International Energy Outlook. • European Union: 25 state European model: examines externalities and life cycle assessment issues. • Six New England States: Analysis of Clean Air Act goals and support for climate change commitments. • USAID: establishing a common framework for assessing demand-side management. • IEA/ETSAP partner institutions: supporting their national governments planning (Canada, UK, Italy, U.S. DOE & EPA) • China and India: examining reform and energy sector evolution to meet economic development goals, and developing multi-region national models. • APEC: cost-effective levels of renewable generation in 4 APEC economies. • ASEAN: 8 countries participating in a AusAID sponsored energy planning initiative • Three Central America countries: baselines and opportunities within the realm of Climate Change. • Bolivia: GHG reduction strategies, including modeling of forestation as a carbon reduction option. • South Africa: National energy and environmental planning.
MARKAL Data Requirements • Useful Energy Demands, and own price elasticities for MED or demand decoupling factors for MACRO • Costs • Resource, investment, fixed, variable, fuel delivery, hurdle rates • Technology Profiles • Fuels in/out, efficiency, availability • Resource supply steps, cumulative resources limits, installed capacity, new investment • Environmental Impacts • Unit emissions per resource, technology, investment • System and other parameters • Discount rate, seasonal/day-night fractions, electric reserve margin
MARKAL Support & Training • Technical support offered by phone and email. • Cost is US $500-$2500 depending on institutional arrangements. • Training is offered through ETSAP and its partners in different parts of the world. • A minimum of 2 trainings of 4 days each are recommended, with follow-up support included. • Cost is US $15,000-$40,000 plus expenses.
For more information on MARKAL/TIMES • Gary Goldstein • International Resources Group • Sag Harbor, New York, 11963, USA • Phone: +1 (631) 725-1869 • Fax: +1 (631) 725-1869 • Email: ggoldstein@irgltd.com • www.etsap.org
Module 5.1e ENPEP-BALANCE
ENPEP • The Energy and Power Evaluation Program (ENPEP) is a set of ten integrated energy, environmental, and economic analysis tools. • Here the focus is on one tool, BALANCE, which is most frequently used for the integrated assessment of energy and GHG emissions. • BALANCE is a market-based simulation that determines how various segments of the energy system may respond to changes in energy prices and demands. • BALANCE consists of a system of simultaneous linear and nonlinear relationships that specify the transformation of energy quantities and energy prices through the various stages of energy production, processing, and use. • BALANCE also calculates emissions of GHGs and local air pollutants. • BALANCE can be run in combination with other ENPEP tools, such as MAED and WASP.
BALANCE Approach • Matches demands for energy with available resources and technologies. • The user creates an energy network that traces the flow of energy from primary resources to useful energy demands. • Networks are constructed graphically using various nodes and links. • Nodes represent resources, conversion processes, energy demands, and economic processes. • Links connect the nodes and transfer information among nodes.
BALANCE Market Share Simulation • A logit function estimates the market share of supply alternatives based on commodity’s price relative to alternatives. • Other constraints (e.g., capacity limits), government policies (taxes, subsidies, etc.), and the ability of markets to respond to price signals can also be modeled. • Consumer preferences can also be included via a “premium multiplier” variable. • Simultaneously balances supply and demand curves for all fuels. • Equilibrium is reached at market clearing prices and quantities. • Does not minimize costs. Instead, simulates the response of consumers and producers.
Other ENPEP Modules • MACRO-E: feedbacks between the energy sector and the wider economy. • MAED: a bottom-up energy demand model. • LOAD: hourly electric loads and generates load duration curves for use in other ENPEP modules. • PC-VALORAGUA: optimal generating strategy for mixed hydro-thermal electric power systems. • WASP: least-cost electric generation expansion paths. • GTMax: marketing and system operational issues in deregulated energy markets. • ICARUS: reliability and economic performance of alternative electric generation expansion paths. • IMPACTS: physical and economic damages from air pollution (now part of BALANCE). • DAM: a decision analysis tool used to analyze tradeoffs between technical, economic, and environmental concerns.
ENPEP Applications • ENPEP has been used extensively in Africa, Asia, Europe and North and South America for a variety of integrated energy analyses. • Many countries used ENPEP to help prepare GHG mitigation assessments as part of their initial national communications to the UNFCCC. • Numerous ENPEP applications are described at the ENPEP web site, in most cases with links to related reports.
BALANCE Support & Training • Technical support offered by phone, email, or on-line. • Basic support is free; premium support packages available for up to US $10,000 per year. • Training is offered by the developers on-site or at ANL. • Since 1978, ANL has trained over 1300 experts from over 80 countries. • Minimum of 5 days training is recommend. • Cost is US $10,000 plus expenses.
For more information on ENPEP: • Guenter Conzelmann • Center for Energy, Economic, and Environmental Systems Analysis (CEEESA), Argonne National Laboratory (ANL) • 9700 South Cass Avenue, Argonne, IL 60439, USA • Phone: +1 (630) 252-7173 • Fax: +1 (630) 252-6073 • Email: guenter@anl.gov • http://www.dis.anl.gov/CEEESA/ENPEPwin.html
Module 5.1f LEAP: Long-range Energy Alternatives Planning System
Long-range Energy Alternatives Planning System • An integrated energy-environment, scenario-based modeling system. • Based on simple physical accounting and simulation modeling approaches. • Flexible and intuitive data management and advanced reporting. • Scope: demand, transformation, resource extraction, GHG emissions and local air pollutants, full system social cost-benefit analysis, non-energy sector sources and sinks. • Annual time-step, unlimited number of years. • Methodology: physical accounting for energy demand and supply via a variety of methodologies. • Optional specialized methodologies for modeling of certain sectors/issues. E.g. stock/turnover modeling for transport analyses. • Links to MS-Office (Excel, Word and PowerPoint). • Low initial data requirements (for example costs not required for simplest energy and GHG assessment). Many aspects optional.
Compared to ENPEP and MARKAL • Unlike ENPEP and MARKAL, LEAP does not require the user to subscribe to a particular view of how an energy system behaves (e.g. least cost optimization, market-clearing equilibrium). • Instead LEAP is based on relatively simple physical energy and environmental accounting principles. • Thus all of the basic calculations in LEAP are non-controversial and can be easily verified, making the system highly transparent. • Instead of the model endogenously calculating market shares of devices, in LEAP the user must tell the software how those shares will evolve in each scenario. • Thus instead of using a complex tool that tells you “what’s best”, the approach in LEAP is to use a relatively simple tool that makes it quick and easy for the user to explore the implications (cost, GHGs, etc.) of different hypothetical scenarios.
Expressions in LEAP • Basic non-controversial energy-environment accounting relationships are built-in to LEAP. • Data are specified using spreadsheet-like expressions. • Expressions can be simple static values or they can be time-series functions that describe how variables change over time in different scenarios. • Expressions can also be used to create relationships between variables: allowing for engineering, econometric or simulation models. • Expressions can also be used to create live links to Excel spreadsheets: allowing LEAP to function as an overall organizing and integrating framework for separate spreadsheet analyses.
Expression Examples • Growth(3.2%)Exponential growth after the base year. • Interp(2000, 40, 2010, 65, 2020, 80)Interpolates between specified data points. • Step(2000, 300, 2005, 500, 2020, 700)Discrete changes in particular years. • GrowthAs(Income,e)Future years calculated from rate of growth in variable “Income” and an elasticity variable, “e”. • Interp(c:\sample.xls,Importrange)Interpolate based on values in range “importrange” from sheet “sample.xls”
Scenarios in LEAP • Scenarios are story-lines about how an energy system might evolve over time. Can be used for analysis of alternative policy assumptions and for sensitivity analysis. • In LEAP, the Scenario Manager is used to create a hierarchy of scenarios. • Typically users create one baseline scenario, and one or more scenarios used to screen individual policies or measure. • These policy scenarios are then combined to form overall integrated mitigation scenarios, which examine the interactions between measures. • Default expressions are inherited from one scenario to another, thus minimizing data entry and allowing common assumptions to be edited in one place. • On screen, expressions are color coded to show which have been entered explicitly in a scenario (blue), which are inherited from a parent scenario (black), and which are inherited from another region (purple).
Households Lighting Existing (80%, 400 kWh/yr) Urban(30%) Electrified(100%) (8 million) (100%) Efficient (20%, 300kWh/yr) Refrigeration (80%) Cooking (100%) Electrified(20%) Rural(70%) Other (50%) Non-Electrified(80%) A Simple Demand Data Structure • The tree is the main data structure used for organizing data and models, and for reviewing results. • Icons indicate the types of data (e.g., categories, technologies, fuels and environmental effects). • Users can edit the tree on-screen using standard editing functions (copy, paste, drag & drop) • Structure can be detailed and end-use oriented, or highly aggregate (e.g. sector by fuel). • Detail can be varied from sector to sector.
Transformation Analysis • Process analysis of energy conversion, transmission and distribution, and resource extraction. • Capacity additions specified by user or added automatically by model to maintain planning reserve margin. • Choice of methods for simulation of electric dispatch to meet peak power requirements and load shape. • Calculates imports, exports and primary resource requirements. • Tracks costs and environmental loadings.