Download
1 / 16
160 likes | 339 Vues
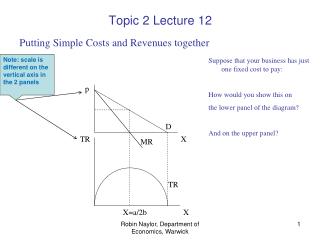
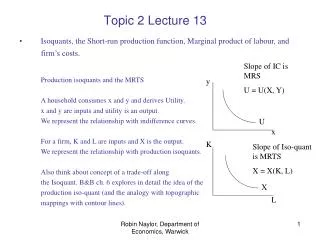
Topic 2 Lecture 15. SATC. SMC. MC. SAVC. SAVC. D. X. Now we add a curve to the diagram to show the Demand Curve which the firm faces. Where is the firm’s Marginal Revenue curve (see Lecture 11 slide 7)?. Topic 2 Lecture 15. SATC. SMC. SMC. SAVC. SAVC. D. X. MR.

E N D
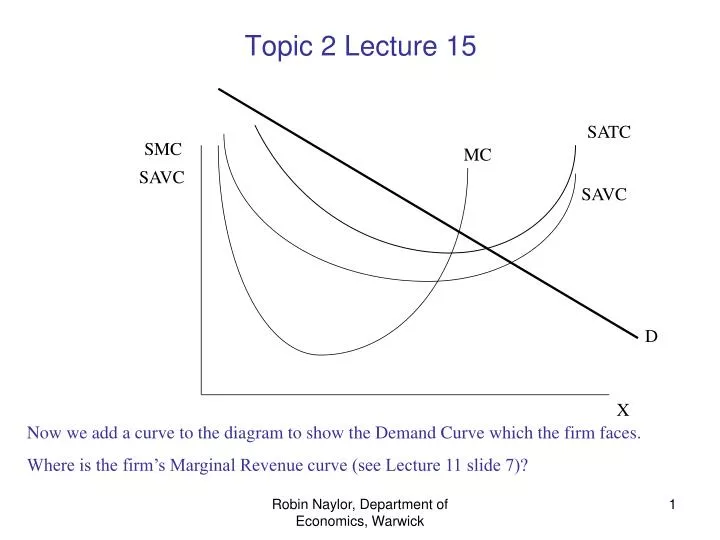
Topic 2 Lecture 15 SATC SMC MC SAVC SAVC D X Now we add a curve to the diagram to show the Demand Curve which the firm faces. Where is the firm’s Marginal Revenue curve (see Lecture 11 slide 7)? Robin Naylor, Department of Economics, Warwick
Topic 2 Lecture 15 SATC SMC SMC SAVC SAVC D X MR What is the firm’s profit-maximising output? And the price? Robin Naylor, Department of Economics, Warwick
Topic 2 Lecture 15 p SATC SMC SAVC D X MR What in the diagram represents the extent of the firm’s (Super-normal) Profit? Robin Naylor, Department of Economics, Warwick
Topic 2 Lecture 15 p SATC SMC SAVC D X MR How do we represent: STC? STVC? STFC? Robin Naylor, Department of Economics, Warwick
Topic 2 Lecture 15 SATC p SMC SAVC X Now add a curve to the diagram to show a lower Demand Curve . . . Robin Naylor, Department of Economics, Warwick
Topic 2 Lecture 15 SATC p SMC SAVC X Now add a curve to the diagram to show a lower Demand Curve . . . Robin Naylor, Department of Economics, Warwick
Topic 2 Lecture 15 SATC p SMC SAVC p* D MR X* X Now add the MR Curve to determine the profit-maximising market output by the firm and its chosen price. What can you say about the extent of profits? Robin Naylor, Department of Economics, Warwick
Topic 2 Lecture 15 SATC p SMC SAVC A p* D MR X* X What can you say about the extent of profits at X*? What would be the extent of the loss if the firm produced nothing? Robin Naylor, Department of Economics, Warwick
Topic 2 Lecture 15 SATC p SMC SAVC SATC(X*) A p* B SAVC(X*) D MR X* X What would be the extent of the loss if the firm produced nothing (X = 0)? So where does the firm produce: X = X* or X = 0? Robin Naylor, Department of Economics, Warwick
Topic 2 Lecture 15 p SATC SMC SATC(X*) SAVC SAVC(X*) p* D MR X* X In the previous slide, SATC(X*) > p* > SAVC(X*). Now consider SATC(X*) > SAVC(X*) > p*. Robin Naylor, Department of Economics, Warwick
Topic 2 Lecture 15 p SATC SMC SATC(X*) SAVC SAVC(X*) p* D MR X* X What is the extent of the loss if the firm produces nothing (X = 0)? It’s given by STFC: which is represented in the diagram by . . . ? Note: STFC = SAFC.X = (SATC – SAVC)X. Robin Naylor, Department of Economics, Warwick
Topic 2 Lecture 15 p SATC SMC SATC(X*) SAVC SAVC(X*) p* D MR X* X So, the loss associated with producing at X = X* now exceeds the loss associated with producing at X = 0: because p* < SAVC(X*). This suggests the following (Shut-Down) Rule . . . Robin Naylor, Department of Economics, Warwick
Topic 2 Lecture 15 p SATC SMC SATC(X*) SAVC SAVC(X*) p* D MR X* X Produce at X* (where MR = MC) so long as p* ≥ SAVC(X*): otherwise produce at X = 0 (i.e., shut-down production) and make minimal losses of STFC. Robin Naylor, Department of Economics, Warwick
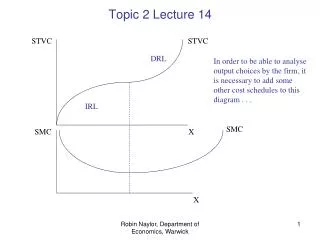
Topic 2 Lecture 15 In the long-run, all inputs (K and L) are variable. p LAC LMC IRS DRS In the long-run, we talk about ‘returns to scale’ as both labour and capital inputs can be varied. X There is no such thing as ‘LAFC’. Hence, LATC = LAVC. We call it LAC, for short. An important matter is the relationship between the SATC curve and the LAC: See B&B pp. 306-310 and also Morgan Katz and Rosen pages 345-349 and Estrin et al pages 177-180. Robin Naylor, Department of Economics, Warwick
Topic 2 Lecture 15 In the long-run, we get the entry/exit rules: p LAC LMC p* LAC* D MR X Enter if p* ≥LAC(X*). Exit (or do not enter) if p* < LAC(X*). Robin Naylor, Department of Economics, Warwick
Topic 2: Lecture 15 Now revise B&B 4th Ed., Chapter 6 (especially pp. 204-210) and read pp. 305-308, 302-303 and then 308-310 and 292-302. Robin Naylor, Department of Economics, Warwick