Download
1 / 68
680 likes | 897 Vues
Obesity – Growing epidemic. Center for Disease Control and Prevention 2006. Obesity – Growing epidemic. 65% Americans overweight or obese 30-40% Americans are obese (~100 million) Doubled in past 20 years Tripled in past 30 years. Obesity Trends* Among U.S. Adults BRFSS, 1985.

E N D
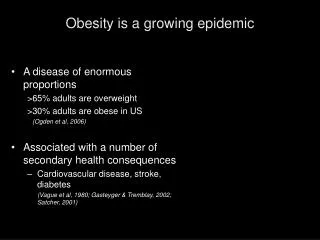
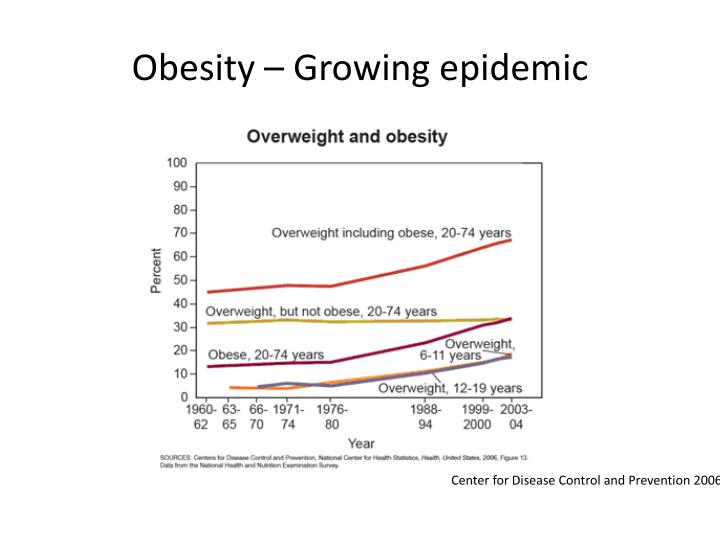
Obesity – Growing epidemic Center for Disease Control and Prevention 2006
Obesity – Growing epidemic • 65% Americans overweight or obese • 30-40% Americans are obese (~100 million) • Doubled in past 20 years • Tripled in past 30 years
Obesity Trends* Among U.S. AdultsBRFSS, 1985 (*BMI ≥30, or ~ 30 lbs. overweight for 5’ 4” person) No Data <10% 10%–14%
Obesity Trends* Among U.S. AdultsBRFSS, 1986 (*BMI ≥30, or ~ 30 lbs. overweight for 5’ 4” person) No Data <10% 10%–14%
Obesity Trends* Among U.S. AdultsBRFSS, 1987 (*BMI ≥30, or ~ 30 lbs. overweight for 5’ 4” person) No Data <10% 10%–14%
Obesity Trends* Among U.S. AdultsBRFSS, 1988 (*BMI ≥30, or ~ 30 lbs. overweight for 5’ 4” person) No Data <10% 10%–14%
Obesity Trends* Among U.S. AdultsBRFSS, 1989 (*BMI ≥30, or ~ 30 lbs. overweight for 5’ 4” person) No Data <10% 10%–14%
Obesity Trends* Among U.S. AdultsBRFSS, 1990 (*BMI ≥30, or ~ 30 lbs. overweight for 5’ 4” person) No Data <10% 10%–14%
Obesity Trends* Among U.S. AdultsBRFSS, 1991 (*BMI ≥30, or ~ 30 lbs. overweight for 5’ 4” person) No Data <10% 10%–14% 15%–19%
Obesity Trends* Among U.S. AdultsBRFSS, 1992 (*BMI ≥30, or ~ 30 lbs. overweight for 5’ 4” person) No Data <10% 10%–14% 15%–19%
Obesity Trends* Among U.S. AdultsBRFSS, 1993 (*BMI ≥30, or ~ 30 lbs. overweight for 5’ 4” person) No Data <10% 10%–14% 15%–19%
Obesity Trends* Among U.S. AdultsBRFSS, 1994 (*BMI ≥30, or ~ 30 lbs. overweight for 5’ 4” person) No Data <10% 10%–14% 15%–19%
Obesity Trends* Among U.S. AdultsBRFSS, 1995 (*BMI ≥30, or ~ 30 lbs. overweight for 5’ 4” person) No Data <10% 10%–14% 15%–19%
Obesity Trends* Among U.S. AdultsBRFSS, 1996 (*BMI ≥30, or ~ 30 lbs. overweight for 5’ 4” person) No Data <10% 10%–14% 15%–19%
Obesity Trends* Among U.S. AdultsBRFSS, 1997 (*BMI ≥30, or ~ 30 lbs. overweight for 5’ 4” person) No Data <10% 10%–14% 15%–19% ≥20%
Obesity Trends* Among U.S. AdultsBRFSS, 1998 (*BMI ≥30, or ~ 30 lbs. overweight for 5’ 4” person) No Data <10% 10%–14% 15%–19% ≥20%
Obesity Trends* Among U.S. AdultsBRFSS, 1999 (*BMI ≥30, or ~ 30 lbs. overweight for 5’ 4” person) No Data <10% 10%–14% 15%–19% ≥20%
Obesity Trends* Among U.S. AdultsBRFSS, 2000 (*BMI ≥30, or ~ 30 lbs. overweight for 5’ 4” person) No Data <10% 10%–14% 15%–19% ≥20%
Obesity Trends* Among U.S. AdultsBRFSS, 2001 (*BMI ≥30, or ~ 30 lbs. overweight for 5’ 4” person) No Data <10% 10%–14% 15%–19% 20%–24% ≥25%
Obesity Trends* Among U.S. AdultsBRFSS, 2002 (*BMI ≥30, or ~ 30 lbs. overweight for 5’ 4” person) No Data <10% 10%–14% 15%–19% 20%–24% ≥25%
Obesity Trends* Among U.S. AdultsBRFSS, 2003 (*BMI ≥30, or ~ 30 lbs. overweight for 5’ 4” person) No Data <10% 10%–14% 15%–19% 20%–24% ≥25%
Obesity Trends* Among U.S. AdultsBRFSS, 2004 (*BMI ≥30, or ~ 30 lbs. overweight for 5’ 4” person) No Data <10% 10%–14% 15%–19% 20%–24% ≥25%
Obesity Trends* Among U.S. AdultsBRFSS, 2005 (*BMI ≥30, or ~ 30 lbs. overweight for 5’ 4” person) No Data <10% 10%–14% 15%–19% 20%–24% 25%–29% ≥30%
Obesity Trends* Among U.S. AdultsBRFSS, 2006 (*BMI ≥30, or ~ 30 lbs. overweight for 5’ 4” person) No Data <10% 10%–14% 15%–19% 20%–24% 25%–29% ≥30%
Obesity Trends* Among U.S. AdultsBRFSS, 2007 (*BMI ≥30, or ~ 30 lbs. overweight for 5’ 4” person) No Data <10% 10%–14% 15%–19% 20%–24% 25%–29% ≥30%
Obesity Trends* Among U.S. AdultsBRFSS, 2008 (*BMI ≥30, or ~ 30 lbs. overweight for 5’ 4” person) No Data <10% 10%–14% 15%–19% 20%–24% 25%–29% ≥30%
Obesity Trends* Among U.S. AdultsBRFSS, 2008 (*BMI ≥30, or ~ 30 lbs. overweight for 5’ 4” person) No Data <10% 10%–14% 15%–19% 20%–24% 25%–29% ≥30%
Obesity Trends* Among U.S. AdultsBRFSS, 2008 (*BMI ≥30, or ~ 30 lbs. overweight for 5’ 4” person) Among U.S. Veterans, the prevalence of obesity may be as high as 75% No Data <10% 10%–14% 15%–19% 20%–24% 25%–29% ≥30%
Overweight United States 65% Australia 59% Russia 54% United Kingdom 51% Brazil 36% China 15%
Europe >50% are overweight 30% BMI>30 kg/m2 10% BMI>40 kg/m2 Rizzello et al., Obes Surg 2010; 20:55
Obesity – Growing epidemic • National Health and Nutrition Examination Survey (NHANES) • Obesity data 2007-8 compared to data 1999-2006 • First trend toward plateau: Flegal KM et.al., JAMA 2010; 303(3)
Obesity – Growing epidemic • National Health and Nutrition Examination Survey (NHANES) • Obesity data 2007-8 compared to data 1999-2006 • First trend toward plateau: GOOD NEWS?! Flegal KM et.al., JAMA 2010; 303(3)
Obesity – Health impact • Comorbid conditions • Type 2 diabetes/Insulin resistance • Cardiovascular disease • Hypercholesterolemia, Hyperlipidemia • Hypertension • Osteoarthritis • Cancer • Liver disease (nonalcoholic steatohepatitis) • Obstructive sleep apnea
Obesity – Health impact Type 2 DM Normal BMI
Obesity – Health impact Type 2 DM CAD Normal BMI BMI
Obesity – Health impact Type 2 DM CAD Normal BMI BMI Hypertension
Obesity – Health impact Type 2 DM CAD Normal BMI Osteoarthritis Hypertension Must A, et.al., JAMA 1999:1523
Obesity – Health impact • Mortality from all causes increases with BMI Adams KF, et.al., NEJM 2006; 355:763
Obesity – Health impact Schauer, D. P. et al. Arch Surg 2010;145:57
Obesity – Health impact Years of Life Lost—BMI and Age Fontaine KR, JAMA 2003; 289:187 Men Women
Obesity – Health impact • In both men and women, BMI is associated with higher rates of death due to Cancer • Esophagus • Colon/Rectum • Liver • Gallbladder • Pancreas • Kidney • Non-Hodgkin’s lymphoma • Multiple myeloma Calle EE et.al., NEJM 2003; 348:1625
Obesity – Health impact - Risk of mortality from cancer according to BMI (for men) --Men and women with BMI>40 kg/m2 had death rates from all cancers that were 52% (men) and 62% (women) higher than the rates in normal weight individuals. Calle EE et.al., NEJM 2003; 348:1625
Obesity – Health impact --Obesity in early adulthood greater risk of pancreatic cancer and a younger age of disease onset Risk of Pancreatic Cancer Li et.al., JAMA 2009; 301:2553
Obesity – Economic burden • Overweight and obesity account for nearly 10% of total U.S. medical expenditures • >$100 billion • Morbid obesity associated with >$11 billion direct health care costs Center Disease Control and Prevention 2009
Obesity – Economic burden Obesity-attributable direct medical costs, by state Center for Disease Control & Prev Millions $ State
Obesity – Economic burden Obesity-attributable direct medical costs, by state Center for Disease Control & Prev California: $7.7 Billion Millions $ State
Obesity – Economic burden Mean per capita annual health care expenditure $3,506 $3,058 Women aged 25-34 $2,873 $2,358 $2,127 Dollars 20-24.9 25-29.9 30-34.9 35-39.9 >40 Wee et.al., Am J Public Health 2005 BMI