Download
1 / 64
640 likes | 850 Vues
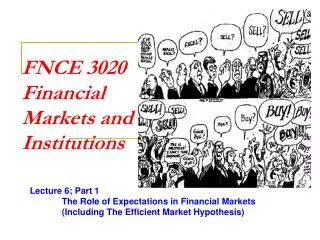
FNCE 4070 FINANCIAL MARKETS AND INSTITUTIONS. Lecture 4 The Behavior of Interest Rates. Foreign Cartoons: Interest Rates. Japan: 2006. Australia: 2008. Background on Cartoons. Japan: AA Corporate Rates Compared to U.S. Australia: Reserve Bank Interest Rate Target.

E N D
FNCE 4070FINANCIALMARKETS ANDINSTITUTIONS Lecture 4 The Behavior of Interest Rates
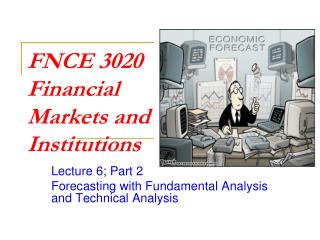
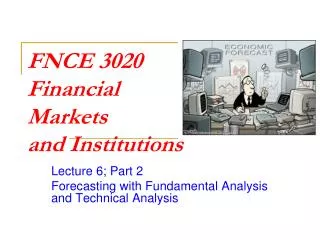
Foreign Cartoons: Interest Rates Japan: 2006 Australia: 2008
Background on Cartoons Japan: AA Corporate Rates Compared to U.S. Australia: Reserve Bank Interest Rate Target
Explaining Interest Rates • There are two possible approaches to explaining the behavior (i.e., movement) of interest rates: • (1) Demand and Supply models: • (1) Model based on the demand for and supply of loanable funds (i.e., debt instruments) in financial markets (Chapter 2 in the text). • (2) Model based on the demand for and supply of various debt instruments (i.e., bonds) in the economy (See appendix 1 at end of this lecture). • (2) Understanding (through empirical analysis) critical variables that are likely to result in a change in interest rates: • Variables, such as inflation (inflation expectations), business cycles, central bank actions, safe haven effects. • These two approaches are also important because they can be used to help us forecast interest rate changes.
Variables Affecting Interest Rates • The second approach to understanding the behavior of interest rates is to understand the critical factors that are likely to affect market interest rates. • This check list-approach include: • The inflation relationship to interest rates. • Irving Fisher Model of Interest Rates • The impact of business cycles on interest rates. • Cyclical Model of Interest Rates • The impact of central bank monetary policy actions on interest rates (especially on short term rates) • The impact of a financial crisis on interest rates (risk aversion and flight to quality – safety -- issues).
Fisher Interest Rate Model • Concept developed by the American economist Irving Fisher in his Theory of Interest (1930) • Fisher’s interest rate model states that the market rate of interest is the sum of • (1) a real rate requirement. • The real rate requirement reflects the reward that should accrue to the lender for “lending to a productive economy. “ • (2) the market’s expected rate of inflation (i.e., an inflation premium). • This inflation premium protects investors against this loss of purchasing power. • So: Market interest rate = real rate requirement + inflation expectations. • Irving Fisher (1867-1947); Educated at Yale (Ph.D. in economics in1891) and taught at Yale from 1892 - 1935 • A “classical” economist known for: • Equation of Exchange; (MV = PT) • Phillips Curve • A visible index card system - known today as the rolodex
Fisher Real Rate Requirement • Defined: “The reward for lending into a productive economy.” • Problem: This real rate requirement is much easier to conceptualize than it is to actually measure. • Conceptually, however, it is probably related to growth theory, with an economy’s growth dependent upon productivity of its workforce and population. • So, while the real rate requirement cannot be observed, different estimation methods relying on theoretical “growth” models have suggested: • A range of 2-3% for both the United States and the euro area. • A rate of 3% for the United Kingdom • Sources: Manrique and Manuel Marques (2004), Laubach and Williams (2003), Giammarioli and Valla (2003), Larsen and McKeown (2004)
Inflation - Interest Rate Model • For default-free securities we assume that: • Market rate = real rate requirement + inflationary expectations premium • The assumption is that of the two components, the real rate requirement is relatively stable. • Why? Productivity and population changes are not subject to major short term fluctuations. • However, inflationary expectations can change dramatically over shorter time frames. • For securities with a default component (e.g., corporate bonds) we assume: • Market rate = real rate requirement + inflationary expectations premium + default risk premium • Unlike default free securities, we also need to be aware of changes in default risk premiums which will cause the observed interest rate on these securities to change. • Observation: For default free securities (especially longer term Treasuries),we tend to focus on inflationary expectations as the major factor behind changes in market interest rates. While inflationary expectations play a role in the interest rate structure of non-default free securities, will also need to pay attention to changes in default premiums.
The Fisher Effect in the United States: 1965 - 2011; Long Term Government Interest Rates
The Fisher Effect in the United States: 1965-2008; Short Term Government Interest Rates
Regression Results: 1954 - Present • R-Squares (monthly data): • CPI against 3-month T-Bill Rates: 49.17% • CPI against 20 year T-Bonds: 67.15% • F.F. Rate against 3-month T-Bill Rates: 97.49% • F.F. Rate against 20 year T-Bonds: 84.78% • F.F. Rate against 10 year T-Bonds: 78.78%
The Fisher Effect in the United States: 1965 - 2011; Long Term Corporate (Aaa and Baa) Interest Rates
Regression Results: 1954 - Present • R-Squares (monthly data) • CPI against Aaa Corporate Rate: 41.69% • CPI against Baa Corporate Rate: 41.13%
Regression Results: 1954 - Present • R-Squares (monthly data) • Aaa Corporate Rate against CPI: 41.69% • Aaa Corporate Rate against CPI and Risk of Default Spread (Aaa – 10 Year T-Bonds): 46.02% • Baa Corporate Rate against CPI : 41.13% • Baa Corporate Rate against CPI and Risk of Default Spread (Baa- Aaa): 63.00%
Cumulative Default Rates, 1981-2005 (%): For global and U.S. companies initially rated in 1980
Inflationary Expectations • What do you think influences inflationary expectations in an economy? • Recent inflation data: • “Adaptive response” of market participants to current inflation data. • Forward looking data; how events now might affect future inflation: • Central bank actions (lag effects of policy changes). • What’s happening to the money supply and bank reserves. • Government fiscal policies. • What’s happening to fiscal deficits. • Global demand/supply for key commodities and prospects for future supplies. • Oil, food, etc. • Exchange rates impacting on import prices. • How dependent is the country on critical imports? • Need to examine observed data in relation to some benchmarks. • Recent inflation data in relation to “explicit inflation” targets of governments and central banks. • What the economy actually doing in relation to what it could be doing? • What is the economy’s output gap (actual GDP growth in relation to potential GDP growth)?
Output Gap • Output Gap is a measure of the difference between an economy’s actual output and the output it could achieve when it is at “full capacity.” • There are two types of output gaps: positive and negative. • A positive output gap occurs when actual output is more than full-capacity output. Negative output gap occurs when actual output is less than full-capacity output. • The chart at the right shows the estimated % output gap for the U.S. economy from 1990 to the present. • A negative output gap is shown below the 0 line. A positive output gap, above.
U.S. Output Gap and Inflation: 1980 to 2007 • Economic theory suggests that positive output gap will lead to inflation as labor and production costs rise. • This is also a situation when demand pull inflation is likely to exists. • Findings: Every percentage point by which real GDP falls short of (or exceeds) potential tends to reduce (increase) the inflation rate by about half a point over the course of the year. • Source: Krugman, 2008
Extending the Model to Incorporate Term to Maturity Considerations • The next step in our explanation of interest rates is to incorporate maturity considerations in the model. • Generally, the longer the term to maturity, the greater the potential risk (e.g., price risk). • To extend the Fisher model to consider maturity, we add a maturity premium, or: • Market interest rate = (1) real rate requirement + (2) inflationary expectations premium + (3) maturity premium. • Where the maturity premium compensates for a security’s exposure to interest rate risk (i.e., price risk). Recall, the longer the maturity, the greater the potential risk, hence the greater this maturity premium.
Maturity Premiums on Government Securities Rates on 1 Year, 10 Year and 20 Year Treasuries Maturity Spreads Over Time 1962 – 2008 10 Year: 84 Basis Points 1993 – 2008 10 year: 113 Basis Points 20 Year: 163 Basis Points 2001- 2008 10 year: 169 Basis Points 20 year: 277 Basis Points • 1962 – 2008 • 1 Year: 6.14% • 10 Year: 6.98% • 1993 – 2008 • 1 Year: 4.29% • 10 Year: 5.42% • 20 Year: 5.92% • 2001 – 2008 • 1 Year: 2.73% • 10 Year: 4.42% • 20 Year: 5.50%
Extending the Model to Non-Risk Free Debt Instruments • The final adjustment to this model incorporates a default risk premium, or: • Market interest rate = (1) real rate requirement + (2) inflationary expectations premium + (3) maturity premium + (4) default risk premium • Where the default risk premium compensates for the chance that the borrower will default. • The greater the “estimation” and “expectation” of default, the higher this risk premium.
Historical Default Spreads Aaa - Treasuries Default Spreads 1993 – 2008 Over 30 Year Treasuries: 55 Basis Points Over 20 year Treasuries: 78 Basis Points 2001 – 2008 Over 30 Year Treasuries: 73 Basis Points Over 20 Year Treasuries: 77 Basis Points • 1993 – 2008 • Aaa: 6.70% • 30 Year Treasuries: 6.15% • 20 Year Treasuries: 5.92% • 2001 – 2008 • Aaa: 5.82% • 30 Year Treasuries: 5.09% • 20 Year Treasuries: 5.05%
Business Cycle Impacts on Interest Rates • Question: How do interest rates generally move over the course of a business cycle? • Historically, while we have observed that interest rates have moved in a “pro-cyclical” manner (i.e., they move with the business cycle), i.e., • Rates moving down during a business recession. • Why do you think this is the case? • Rates moving up during a business expansion. • Why do you think this is the case?
Default Spreads Over the Course of a Business Cycle • Default spreads are dependent upon the business cycle and perceptions about the state of the economy. • Rising during economic downturns and during periods of increasing economic and financial uncertainty. • Falling during economic expansions and during periods of decreasing economic and financial uncertainty. • Default spreads influenced by the market’s estimates as to future cash flows available to support outstanding debt obligations.
Observations on Relative Rate Changes • Over time, short term and long term interest rates tend to move in the same direction. • However, short term interest rates exhibit more volatility than long term interest rates. • As measured in basis point changes over time. • Over time, however, prices on long term debt instruments exhibit more volatility than prices on short term debt instruments. • Confirming that there is more price (interest rate) risk associated with these long term securities.
Relative Interest Rates Movements: Short term Versus Long term Interest Rates
Monetary Policy Impacts on Financial Markets • In most countries today (and certainly in all industrial countries), monetary policy uses as its main financial target some key short term interest rate. • United States: Federal Funds Rate • Bank of England: Official Bank Rate • European Central Bank: Main Refinancing Rate • Bank of Japan: Uncollateralized Overnight Call Rate • View these interest rates at: http://www.bis.org/cbanks.htm • This managed key interest rate is used to achieve inflation goals and other economic goals. • Issue for financial markets: How strong is the relationship of this key interest rate to other market interest rates? • In major industrial countries, this relationship is very strong with the key monetary policy rate producing almost immediate changes in short term interest rates.
Monetary Policy Reactions to Business Cycles • Another issue is the response of central bankers to business cycles. • Issue: Do they raise rates during expansions and reduce them during recessions? • Answer: Generally Yes • Second issue: Are central bankers proactive or reactive to business cycle changes? • Do they anticipate future economy activity and act in response to their forecasts (proactive), or do they react as the economy changes (reactive). • This would result in either central bank interest rates leading economic activity or taking place at the same time or after the business cycle turning point. • U.S. proactive. Other central banks present a mixed picture.
Response of U.S. Monetary Policy to Business Cycles, 1965 - 2009
Inflation Targeting and Monetary Policy Induced Interest Rate Changes • An additional central bank issue occurs because of the recent adoption of inflation targeting by many central banks. • View these targets at: http://www.bis.org/cbanks.htm • Note: U.S. Federal Reserve adopted an “implicit” 2% long term inflation target in January 2008. • Issue: As announced inflation targets are exceeded, should we be on the alert for central bank interest rate response. • Specifically, as inflation targets are exceeded, central banks will probably raise their key short term interest rate to slow the economy (demand) and ease inflationary pressures back to their announced target.
Safe Haven Effects • The last issue to be explored is that of a safe haven effect. • Investments in “safe haven” financial assets occurs during periods of financial, economic, political, military uncertainty. • The greater the uncertainty, the greater the demand for “safe haven” financial assets. • Examples of safe haven financial assets: • Government securities (especially short term) • Key currencies (US dollar, Swiss franc) • Precious metals (gold, silver). • Increase safe haven demand will push up the prices of these assets and in the case of government securities, drive down their interest rates.
Safe Haven Effect: T-Bills • January 2007: 4.98% December 2008: 0.03%
Safe Haven Effect: U.S. Dollar • Desert Storm begins: February 24, 1991
Safe Haven Effect: Swiss Franc • Percent Change in the U.S. Dollar (Note: CET = Central European Time)
Appendix 1 Bond Market Model This appendix discusses the demand and supply bond market model which can be used to explain changes in the market’s equilibrium interest rate
Bond Market Model • The bond market model uses a demand and supply approach to illustrate how market interest rate changes come about. • The model focuses initially on factors that will cause the price of bonds to change. • Since there is an inverse relationship between prices and interest rates, the final step in the model relates to resulting interest rate change from assumed demand and supply changes. • The bond market model incorporates: • (1) a demand curve; which plots the relationship between the market’s demand for bonds and the prices of bonds (holding all other factors constant), and • (2) a supply curve; which plots the relationship between the market’s supply of bonds and the prices of bonds (holding all other factors constant. • Model assumes that at any point in time, these two curves can be represented as follows (see next slide):
Demand and Supply Schedules Demand P Supply Q • Bond Demand Schedule: • Assumes that as the price (P) of bonds decreases, the demand for bonds will increase because as the price falls, the yield will increase. • Higher yields will increase the demand to hold bonds. • Thus the demand curve is downward sloping (left to right) • Bond Supply Schedule: • Assumes that as the price (P) of bonds increases, the supply of bonds will increase because as the price rises, the cost to borrow will fall. • Lower borrowing costs will increase the supply of bonds offered by borrowers. • Thus the supply curve is upward sloping (left to right)
Equilibrium in the Bond Market Demand P Supply Q • Bond Market Price Equilibrium: • This is the point where the amount of bonds an economy is willing to buy (i.e., demand) equals the amount of bonds an economy is willing to sell (i.e., supply). • Also referred to as the market clearing price (which in turn produces a market clearing interest rate; or yield to maturity). • Think of the market clearing interest rate as the economy’s required return.