Download
1 / 44
440 likes | 583 Vues
An Overview of Recent Trends in Health Coverage for Low-Income Children and Families David Rousseau Kaiser Commission on Medicaid and the Uninsured and Donna Cohen Ross Center on Budget and Policy Priorities Secretary’s Advisory Committee on Infant Mortality Washington, DC November 11, 2004.

E N D
An Overview of Recent Trends in Health Coverage for Low-Income Children and FamiliesDavid RousseauKaiser Commission on Medicaid and the UninsuredandDonna Cohen RossCenter on Budget and Policy PrioritiesSecretary’s Advisory Committee on Infant MortalityWashington, DCNovember 11, 2004
Figure 1 Health Insurance Coverage of Children, By Income, 2003 Low-Income Children* 33.4 million All Children 77.6 million * Below 200% of the federal poverty level, or $29,360 for a family of three in 2003 (according to the U.S. Census Bureau’s poverty thresholds). SOURCE: Urban Institute and Kaiser Commission on Medicaid and the Uninsured analysis of March 2004CPS.
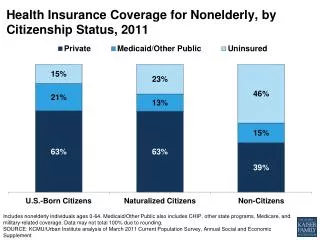
Figure 2 Characteristics of Uninsured Children, 2003 Citizenship Income Family Work Status US Citizen- Naturalized 1% Part-Time Workers 9% 200% FPL and Above 26% Non-Citizen 13% <100% FPL 44% No Workers 24% 1 or More Full-Time Workers 67% 100-199% FPL 30% US Citizen 86% Total = 9.1 million uninsured Note: The federal poverty was $14,680 for a family of three in 2003. SOURCE: KCMU and Urban Institute analysis of the March 2004 Current Population Survey.
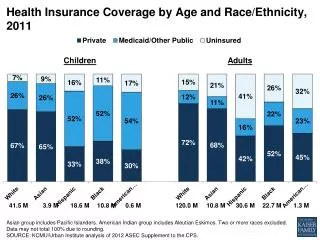
Figure 3 Health Insurance Coverage of Low-Income Children, 2003 23% Poor (<100% Poverty) Near-Poor (100-199% Poverty) 60% 23% 39% 17% Under 1 59% 18% 1 to 5 years 57% 16% Medicaid 6 to 17 years 47% 21% Uninsured 18 years 30% 35% 35% Hispanic Asian/ S. Pacific Islander 52% 27% African-American 57% 19% 39% 27% White 44% 16% 19% 16% Note: The federal poverty level was $14,680 for a family of three in 2003 (according to the U.S. Census Bureau’s poverty thresholds). SOURCE: Urban Institute and Kaiser Commission on Medicaid and the Uninsured analysis of March 2004 CPS.
Figure 4 Uninsured Rate Among Low-Income Children by State, 2002-2003 NH VT WA ME MT ND MN MA OR NY ID SD WI RI MI CT WY PA NJ IA NE OH IN DE NV IL WV UT VA MD CO CA KS MO KY NC DC TN OK SC AR AZ NM AL GA MS TX LA AK FL HI Percent of Low-Income Children Without Coverage: < 15% (14 states and DC) 15% - < 21% (20 states) > 21% (16 states) SOURCE: Urban Institute & Kaiser Commission on Medicaid & the Uninsured analysis of 2003-2004 CPS.
Figure 5 44.7 M 43.3 M 40.9 M 39.6 M Number of Uninsured Children and Adults, 2000-2003 In Millions Note: Sums may not equal totals due to rounding. SOURCE: KCMU and Urban Institute estimates based on the March Current Population Surveys, 2001-2004.
Figure 6 Changes in Health Insurance Coverage, Children vs. Adults, 2000-2003(Percentage Point Differences) Employer 5% 3% 0% -3% -3.8% -5% -4.3% Notes: All differences are statistically significant (p<.10). Medicaid also includes SCHIP, other state programs, Medicare and military-related coverage. SOURCE: KCMU and Urban Institute analysis of March Current Population Survey, 2001 and 2004.
Figure 6 Changes in Health Insurance Coverage, Children vs. Adults, 2000-2003(Percentage Point Differences) Employer Medicaid 4.8% 5% 3% 0.8% 0% -3% -3.8% -5% -4.3% Notes: All differences are statistically significant (p<.10). Medicaid also includes SCHIP, other state programs, Medicare and military-related coverage. SOURCE: KCMU and Urban Institute analysis of March Current Population Survey, 2001 and 2004.
Figure 6 Changes in Health Insurance Coverage, Children vs. Adults, 2000-2003(Percentage Point Differences) Change in Uninsured: Children -0.3 Million Adults 5.4 Million Notes: All differences are statistically significant (p<.10). Medicaid also includes SCHIP, other state programs, Medicare and military-related coverage. SOURCE: KCMU and Urban Institute analysis of March Current Population Survey, 2001 and 2004.
Figure 7 Health Insurance Coverage Changes Among Low-Income Children, 2000-2003 Percent of Low-Income Children 3.4% Employment- Based Medicaid** CHAMPUS/ Medicare Private, Non-Group Uninsured * Statistically significant change between 2000 and 2003 (at the 95% confidence interval). **Medicaid also includes SCHIP, other state programs. SOURCE: Urban Institute, 2004. Based on data from March CPS, 2001, 2004.
Figure 8 Health Insurance Coverage of Children and Nonelderly Adults, 2003 Private Non Group Employer Medicaid Uninsured < 200% 3% CHILDREN < 19 200% + Medicaid also includes SCHIP, other state programs, Medicare, and military-related coverage. Adults without children includes childless adults and parents whose children are no longer dependents. Less than 200% of poverty level was $29,360 for family of three in 2003. Data may not total 100% due to rounding. KCMU / Urban Institute, 2004
Figure 8 Health Insurance Coverage of Children and Nonelderly Adults, 2003 Private Non Group Employer Medicaid Uninsured < 200% 3% CHILDREN < 19 200% + < 200% PARENTS 200% + Medicaid also includes SCHIP, other state programs, Medicare, and military-related coverage. Adults without children includes childless adults and parents whose children are no longer dependents. Less than 200% of poverty level was $29,360 for family of three in 2003. Data may not total 100% due to rounding. KCMU / Urban Institute, 2004
Figure 8 Health Insurance Coverage of Children and Nonelderly Adults, 2003 Private Non Group Employer Medicaid Uninsured < 200% 3% CHILDREN < 19 200% + < 200% PARENTS 200% + < 200% ADULTS without CHILDREN 200% + Medicaid also includes SCHIP, other state programs, Medicare, and military-related coverage. Adults without children includes childless adults and parents whose children are no longer dependents. Less than 200% of poverty level was $29,360 for family of three in 2003. Data may not total 100% due to rounding. KCMU / Urban Institute, 2004
Figure 9 Medicaid and SCHIP’s Role for Low-Income Children • Medicaid provides comprehensive health coverage with no cost sharing for over 25 million low-income children at a cost of nearly $45 billion in 2003. • SCHIP provides a more limited set of benefits with premiums and cost sharing to roughly 4 million slightly higher income children who are not eligible for Medicaid and or are not covered by private insurance. Total SCHIP spending in 2003 was slightly more than $6 billion. • Together, these programs provide a critical health care safety net to roughly 25% of children in the U.S., covering more than half of all low-income children nationally.
Figure 10 Medicaid and S-CHIP: What’s the difference?
Figure 11 Trends in Uninsured Children by Eligibility Status, 1996-2002 Millions of Uninsured Children 12.2 11.2 10.6 10.0 Source: Selden et al, “Tracking Changes in Eligibility and Coverage Among Children, 1996-2002.” Health Affairs, Vol. 23(5), September/October 2005.
Figure 12 Health Insurance Coverage of Children, by Health Status, 2003 Employer Medicaid Private Non-Group Uninsured Excellent/ Very Good Good Fair/Poor NOTE: Medicaid also includes SCHIP, other state programs, Medicare, and military-related coverage. Data may not total 100% due to rounding. SOURCE: KCMU / Urban Institute, 2004
Figure 13 Physical and Cognitive Limitations and Per Capita Expenditures among Low-Income Children Percent reporting any physical or cognitive limitations (All low-income children) Per capita expenditures in 2001 dollars (Non-disabled children) Note: “Low income” defined as those with incomes less than 200% of the Federal Poverty Level. SOURCE: Analysis of MEPS data from 1996, 1997, 1998, and 1999; Hadley and Holahan, Inquiry 2004.
Figure 14 Access to Care Among Low-Income Children by Insurance Status, 2002 One or More Well-Child Visits One or More Doctor Visits One or More Dental Visits SOURCE: Urban Institute based on 2002 NSAF data, 2004.
Figure 15 Total U.S. SCHIP Enrollment, 1998-2003(Annual) Monthly Enrollment in Thousands Source: Compiled by Health Management Associates from State enrollment reports for KCMU.
Figure 16 Total U.S. SCHIP Enrollment, 2002-2003(Quarterly) Monthly Enrollment in Thousands Percent Change (from previous quarter) 2.8% 2.4% 2.7% - 0.5% - 0.4% Source: Compiled by Health Management Associates from State enrollment reports for KCMU.
Figure 17 Federal Spending for SCHIP Versus Annual Federal Allotments, 1998-2007 Billions of Dollars * Projected spending SOURCE: Based on the Center on Budget and Policy Priorities SCHIP financing model, 2004.
Figure 18 States with Insufficient Federal SCHIP Funding, 2005-2007 18 states AK AZ GA IL IA ME 11 states MD MA AZ 9 states GA MI AK MN IL AR MS MD 6 states KY MO MN ME MS AZ NE MA NJ NE MN NY NY NJ MS NC RI RI NE SC SD NJ SD TN WI RI WI 2005 2006 2007 $1.06 Billion in unspent Federal SCHIP funds in 9 states reverted to the U.S. Treasury on 10/1/2004 States with Projected Federal SCHIP Funding Shortfalls Under Current Law SOURCE: Center on Budget and Policy Priorities, 2004.
Figure 19 Fiscal Setbacks • Financial stress on state budgets and health coverage • Federal fiscal relief averted some cuts • $20 billion in fiscal relief, including $10 billion Medicaid matching rate increase • Match increase provided immediate relief • But, after steady progress, some states are moving backwards • Reductions in eligibility; rollbacks in parent coverage • Drops in SCHIP enrollment • Federal fiscal relief expired June 30, 2004
Figure 20 Challenges for the Future • Threats to coverage continue to grow • Employer erosion • Medicaid/SCHIP cutbacks • Continuing unemployment • Costs rising • Increasing health costs • Rising premiums for private coverage • Public resources constrained • Federal deficits • State budget crisis • Public coverage less able to absorb declines in employer sponsored insurance
Figure 21 Where We’ve Come From • A trio of effective strategies helped boost enrollment in Medicaid and SCHIP. • Expanding eligibility • Simplifying enrollment and renewal procedures • Outreach • States were making steady progress since late 1990s. • Signals that the trends may be reversing began to emerge last year. • Parent coverage retracted • Some simplified procedures retracted
Figure 22 Changes in Eligibility, Enrollment and Renewal Procedures and Cost-Sharing in Medicaid and SCHIP for Children and Parents April 2003 – July 2004 • On the surface: • Income-eligibility remained stable, for the most part. • Beneath the surface: • Nearly half the states (23) made it harder for eligible children and families to secure and retain coverage. • Imposed financial barriers (premiums) • Froze enrollment • Reinstated procedural barriers • Most of the changes were in SCHIP — Medicaid largely protected • States began to see adverse effects on enrollment.
Figure 23 Nearly Half the States Made it More Difficult to Secure and Retain Health Coverage for Children and Families, April 2003-July 2004 Number of States Imposing Enrollment Barriers in Medicaid or SCHIP 23 16 8 8 *Includes states that froze children’s enrollment for at least a portion of the time period April 2003-July 2004. In addition, three states froze enrollment for parents under their Medicaid waiver programs. SOURCE: Based on a national survey conducted by the Center on Budget and Policy Priorities for KCMU, 2004.
Figure 24 States with Premiums or Enrollment Fees in Children’s Health Coverage Programs, July 2004 Number of States Income level at which premium payment required *The Federal Poverty Line (FPL) for a family of three in 2004 is $15,670. SOURCE: Based on a national survey conducted by the Center on Budget and Policy Priorities for KCMU, 2004.
Figure 25 IL States with Enrollment Freezes, April 2003 to July 2004 NH VT WA ME MT ND MN MA OR NY ID SD WI RI MI CT WY PA NJ IA NE OH IN NV DE IL WV UT VA MD CO CA KS MO KY NC DC TN OK SC AR AZ NM AL GA MS TX LA AK FL HI Enrollment Freeze** (8 states) > 200% FPL* (AL, FL, MD, UT) < 200% FPL* (CO, ID, MT, TN) *The Federal Poverty Line (FPL) for a family of three in 2004 is $15,670. **Includes states that froze children’s enrollment for at least a portion of the time period April 2003-July 2004. SOURCE: Based on a national survey conducted by the Center on Budget and Policy Priorities for KCMU, 2004.
Figure 26 Ohio’s “Regular” Medicaid Enrollment for Children, Families, & Pregnant WomenJune 1997-June 2001 Monthly enrollment in thousands • During 2000, Ohio: • Expanded coverage modestly • Adopted a new family application • Reduced verification requirements • Addressed TANF issues Source: KCMU analysis of data reported to Health Management Associates by State Medicaid agencies
Figure 27 Washington State Medicaid Enrollment of Low-Income Children* Number of Children April 2003: Increased verification requirements July 2003: 12-mo. continuous eligibility eliminated; 6-mo. renewal instituted *Children under 200% of the Federal Poverty Line (FPL) who are not eligible for TANF or SSI. SOURCE: Data from Washington’s Caseload Forecast Council website
Figure 28 States Reversing Previously Adopted Procedural Simplifications, 2001-2004 Number of States 11 5 1 SOURCE: Based on a national survey conducted by the Center on Budget and Policy Priorities for KCMU, 2004.
Figure 29 Asset Test Requirements for Children’s Medicaid/SCHIP by State, July 2004 NH VT WA ME MT ND MN MA OR NY ID SD WI RI MI CT WY PA NJ IA NE OH IN NV DE IL WV UT UT VA MD CO CA KS MO KY NC DC TN OK SC AR AZ NM AL GA MS TX LA AK FL HI No asset test in Medicaid or SCHIP (45 states including DC) Asset test in Medicaid and/or SCHIP (6 states) SOURCE: Based on a national survey conducted by the Center on Budget and Policy Priorities for KCMU, 2004.
Figure 30 IL Medicaid Asset Test Requirements for Pregnant Women by State, July 2004 NH VT WA ME MT ND MN MA OR NY ID SD WI RI MI CT WY PA NJ IA NE OH IN NV DE IL WV UT UT VA MD CO CA KS MO KY NC DC TN OK SC AR AZ NM AL GA MS TX LA AK FL HI No asset test in Medicaid for Pregnant Women (45 states including DC) Asset test in Medicaid for Pregnant Women (6 states) SOURCE: Based on a national survey conducted by the Center on Budget and Policy Priorities for KCMU, 2004.
Figure 31 IL Medicaid Presumptive Eligibility for Pregnant Women by State, July 2004 NH VT WA ME MT ND MN MA OR NY ID SD WI RI MI CT WY PA NJ IA NE OH IN NV DE IL WV UT UT VA MD CO CA KS MO KY NC DC TN OK SC AR AZ NM AL GA MS TX LA AK FL HI Presumptive Eligibility for Pregnant Women (29 states including DC) No Presumptive Eligibility for Pregnant Women (22 states) *CO dropped PE after July 2004 SOURCE: Based on a national survey conducted by the Center on Budget and Policy Priorities for KCMU, 2004.
Figure 32 IL Children’s Eligibility for Medicaid/SCHIP by Income, July 2004 NH VT WA ME MT ND MN MA OR NY ID SD WI RI MI CT WY PA NJ IA NE OH IN NV DE IL WV UT VA MD CO CA KS MO KY NC DC TN OK SC AR AZ NM AL GA MS TX LA AK FL HI > 200% FPL,* No Enrollment Freeze (35 states including DC) < 200% FPL, No Enrollment Freeze (8 states) *The Federal Poverty Line (FPL) for a family of three in 2004 is $15,670. **Includes states that froze children’s enrollment for at least a portion of the time period April 2003-July 2004. SOURCE: Based on a national survey conducted by the Center on Budget and Policy Priorities for KCMU, 2004. Enrollment Freeze** (8 states) > 200% FPL (AL, FL, MD, UT) < 200% FPL (CO, ID, MT, TN)
Figure 33 Medicaid Eligibility for Pregnant Women by Income, July 2004 NH VT WA ME MT ND MN MA OR NY ID SD WI RI MI CT WY PA NJ IA NE OH IN NV DE IL WV UT VA MD CO CA KS MO KY NC DC TN OK SC AR AZ NM AL GA MS TX LA AK FL HI > 185% FPL* (16 states including DC) 134% - 185% FPL (26 states) 133% FPL (9 states) *The Federal Poverty Line (FPL) for a family of three in 2004 is $15,670. SOURCE: Based on a national survey conducted by the Center on Budget and Policy Priorities for KCMU, 2004.
Figure 34 Medicaid Eligibility for Working Parents by Income, July 2004 NH VT WA ME MT ND MN MA OR NY ID SD WI RI MI CT WY PA NJ IA NE OH IN NV DE IL IL WV UT VA MD CO CA KS MO KY NC DC TN OK SC AR AZ NM AL GA MS TX LA AK FL HI > 100% FPL* (13 states including DC) 50% - 100% FPL (24 states) < 50% FPL (14 states) *The Federal Poverty Line (FPL) for a family of three in 2004 is $15,670. SOURCE: Based on a national survey conducted by the Center on Budget and Policy Priorities for KCMU, 2004.
Figure 35 Median Medicaid/SCHIP Income Eligibility Threshold for Children, Pregnant Women, and Parents, July 2004 Percent of Poverty Federal Poverty Line for a family of three ($15,670 in 2004) Note: Eligibility levels for parents based on the income threshold applied to a working parent in a family of three. SOURCE: Based on a national survey conducted by the Center on Budget and Policy Priorities for KCMU, 2004.
Figure 36 States Have Not Simplified Health Coverage for Parents to the Extent They Have for Children, July 2004 Number of States SOURCE: Based on a national survey conducted by the Center on Budget and Policy Priorities for KCMU, 2004.
Figure 37 Illinois Continued to Advance on Eligibility, Simplification and Outreach • Expanded eligibility • Increased SCHIP from 185%FPL to 200%FPL • Increased parents coverage (in two stages) from 49%FPL to 133%FPL • Adopted new simplifications • Reduced income verification requirements • Adopted presumptive eligibility for children • Outreach • Continues to support and expand community-based enrollment assistance with payments to KidCare Application Agents (apps have 90% approval rate) • Enrollment increased between January 2003 and September 2004 • 104,000 children (Medicaid and SCHIP) • 72,000 parents
Figure 38 Conclusion • Medicaid and SCHIP played an essential role in preventing an increase in the number of uninsured children over the last three years. • Barriers to coverage — new and reinstituted — are surfacing at a time when there is a need for public programs to be more, not less, accessible. • Majority of changes in SCHIP, Medicaid largely prohibited from imposing harmful barriers (i.e. burdensome cost-sharing; enrollment freezes) • For continued progress on reducing the number of uninsured, sufficient funding — state and federal — is needed to support current caseloads and additional enrollment of eligible people.