Download
1 / 15
150 likes | 292 Vues
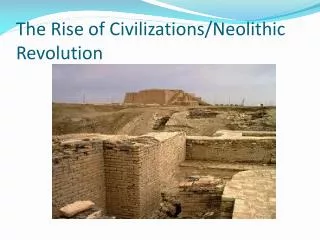
15 years of progress in Radar Altimetry Second Argo Science Workshop. Argo - the integrated approach The 6 year revolution in observing the oceans’ interior Dr W John Gould Argo Project Director

E N D
15 years of progress in Radar Altimetry Second Argo Science Workshop Argo - the integrated approach The 6 year revolution in observing the oceans’ interior Dr W John GouldArgo Project Director National Oceanography Centre - Southampton, UKScripps Institution of Oceanography - La Jolla, USA On behalf of Dean Roemmich - Argo steering Team Co-Chair
Why do we need to measure open ocean temperature, salinity and currents? • Oceans’ role in climate Temperature - governs heat storage. - a major influence on sea level. Salinity - controls the thermohaline circulation. - a means of monitoring global precipitation trends. Velocity - ocean transports of heat and fresh water etc. • Defining the ocean environment - fisheries - fate of pollution - naval operations - boundary conditions for shelf seas • Complementing satellite altimetry - defines internal structure - deep reference velocity level
Pre - Argo sources of ocean T and S profiles • Lowered CTDs from Research ships (T, S and chemistry. Full ocean depth) 1990s WOCE 20,000 CTDs • 8 years • 22 years of ship time • $220m • Data processing ~4 years • XBTs from merchant and research ships (Temperature only to 750m) 2004 ca 30,000 XBTs available in R-T. Note large unsampled areas
WOCE (1990-1998) - the preparation for Argo • WOCE used - satellite altimeters, in-situ observations and models to study oceans’ role in climate. • WOCE needed global subsurface velocities to measure heat and fresh water transports. • Used neutrally buoyant floats modified to be positioned by satellite instead of acoustically. (Autonomous Lagrangian Circulation Explorers - ALACEs)
From WOCE to Argo • WOCE deployed about 1000 floats and for the first time mapped currents across entire ocean basins. • Late in WOCE the floats measured temperature (and later salinity) profiles as they ascended (P-ALACE). • 1999 plan for a 3000 float (3°x3°array) presented to OceanObs’99 conference. Data would be openly available in real-time. This was Argo - to be teamed with Jason • Based on estimated float life, the plan needed ca 820 floats deployed annually. WOCE velocities at 1000m The planned 3000 Argo floats
Building the Argo array 2000 - present • First Argo floats deployed in 2000 Reached target rate in 2004 • Deployments from research ships, merchant ships and aircraft • Initial northern hemisphere bias now corrected 2003 2006
1000 200 100 90 80 70 60 50 40 30 20 10 0 Present status Distribution of present 2400 floats (Red and orange ~100% of 3°x3° target) • Achieving target of real-time data delivery
Profiling depth 66% of array profiles to >1500m, 46% to 2000±50m Argo park and profile operations Standard cycle - park 1000m - profile 2000m - cycle 10 days Typical Argo profile Ca 100 levels
Argo XBT CTD The revolution • Data quantity • Data distribution (Spatial, temporal) • Data added value (salinity and velocity) Salinity sensors ready for pre-deployment calibration Gulf of Alaska circulation Feb 2006
Using Argo profiling float data Argo’s customers Operational ocean/weather/climate forecast and analysis centres. Research scientists Educational and outreach activities
Mercator France 100m temperatureJanuary 2006 300m salinity February 22 2006 JMA Japan Examples from the WWW of operational productsincorporating Argo data UK Met Office 300m salinity 3 day forecast anomaly from Levitus Mar 4 2006 Salinity section CEADO Argentina
Evaluating Argo Argo addition to global observations Research Operational applications New insights Improved models Publicise improvements Evaluation Model applications Peer reviewed papers Societal benefits
Challenges • Needs a consolidation phase - complete array - stabilise technology - optimise array design • Demonstrate Argo’s value. Still under evaluation by operational centres. Partnership with altimetry and data assimilation - GODAE • Funding - move from research base to sustained • Infrastructure
Profiling float technology advances already demonstrated • Improved communication (e.g Iridium, Orbcomm) 2-way, more data. • High resolution, near surface profiling (GHRSST, satellite salinity) • Rapid profiling - Study cyclone generation (better than SSH and SST?) • Monitoring ocean carbon (use proven oxygen capability) • Acoustic wind/rainfall gauges • Under ice operation • Integration of Argo, gliders, timeseries ……
Learn more about Argo • Integrated approach sessions (Wednesday) • Argo Web site portal http://www.argo.net • E-mail questions to argo@ucsd.edu Argo array growth May 2002- Mar 2006