Download
1 / 40
500 likes | 921 Vues
Vibrational Spectroscopy for Pharmaceutical Analysis. Part VII. Introduction to Raman Spectroscopy Rodolfo J. Romañach, Ph.D. Scattering.

E N D
Vibrational Spectroscopy for Pharmaceutical Analysis Part VII. Introduction to Raman Spectroscopy Rodolfo J. Romañach, Ph.D.
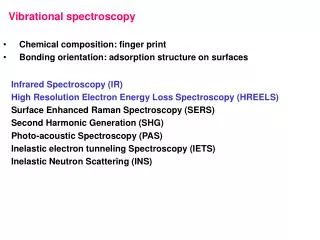
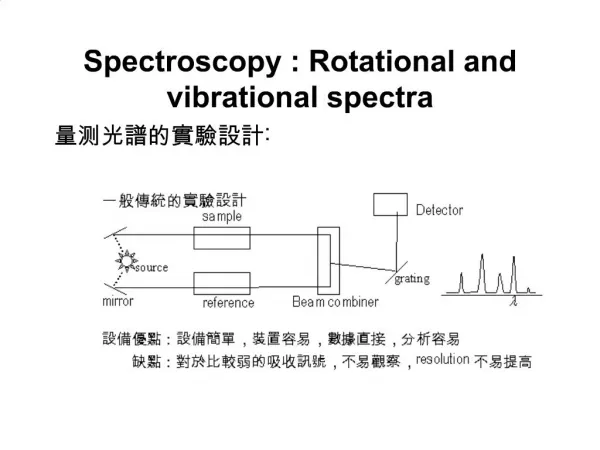
Scattering • Mid-IR and NIR require absorption of radiation from a ground level to an excited state, requires matching of radiation from source with difference in energy states. • Raman spectroscopy involves scattering of radiation (matching of radiation is not required). E. Smith and G. Dent, “Modern Raman Spectroscopy. A Practical Approach.”, Wiley 2005, pages 3 – 5.
Raman Spectroscopy • A single frequency of radiation irradiates the molecule and the radiation distorts (polarizes) the cloud of electrons surrounding the nuclei to form a short-lived state called a “virtual state”. This state is not stable and the photon is quickly re-radiated. E. Smith and G. Dent, “Modern Raman Spectroscopy. A Practical Approach.”, Wiley 2005, pages 3 – 5.
What is Raman Spectroscopy? Raman is a scattering technique LASER Rayleigh scattering: Elastic scatter 1400 1200 1000 Raman : Stokes Anti-Stokes Inelastic scatter 800 Raman Intensity 600 400 200 400 200 0 -200 -400 Raman Shift (cm-1) Slide courtesy Kaiser Optical Systems.
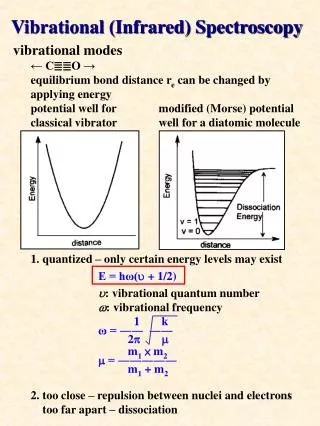
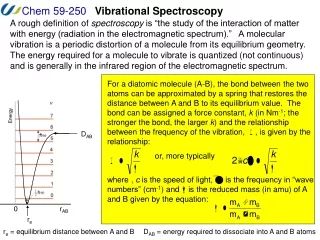
= Vibrational frequency k = Spring force constant = Reduced mass of atoms, m1m2/(m1+m2) Higher vibrational frequency with stronger chemical bond and lighter atoms. ) ( ½ 1 k = 2c Raman Scattering from Molecular Vibrations Stokes – Photon has less energy Rayleigh – Elastic Strongest Component Only one in 106 or 108 photons is Raman scattered. Anti-Stokes – Photon Gains Energy Adapted from Kaiser Optical Systems slide
E1 Virtual state hvex hvex hvex hvex h(vex-vv) h(vex+vv) v=3 E0 v=2 v=1 v=0 Stokes Rayleigh Anti-Stokes Quantum Mechanical Model of Raman Scattering Courtesy Kaiser Optical Systems.
Raman Scattering • The difference in wavelength between the incident and scattered visible radiation corresponds to wavelengths in the mid-infrared region. • An Indian physicist C.V. Raman discovered this effect in 1928. • This has been considered an experimentally difficult technique for many years; but in recent years a number of advances in instrumentation has made it more available to non-specialized labs. Courtesy Kaiser Optical Systems.
Raman Scattering • Sample is irradiated with intense monochromatic radiation usually in the visible or NIR region of the spectrum. • The wavelength is well away from any absorption peaks of the analyte. • The abscissa in the spectra are in terms of wavenumber shift Δυ between the observe radiation and that of the source, and we speak of Raman shift instead of frequency of absorption. Skoog Holler Niemann, p. 429-433, 435 – 441.
Stokes Scattering • Stokes scattering is, by convention, positive-shifted Raman scatter. Most Analytical work is done in this region. • Represents inelastic scattering to a region of lower energy. This means that the energy of the detected radiation is higher in wavelength relative to the laser. • The scattered spectrum appears similar to an IR spectrum and is interpreted similar IR spectrum. Adapted from Kaiser Optical Systems slide
Raman Scattering • C=C, and C≡C, C≡N bonds are strong scatterers, bonds undergo polarization. • Symmetric stretches undergo greater changes in polarization, and are stronger in Raman than asymmetric stretches. E. Smith and G. Dent, Wiley 2005, page 6.
Advantages of Raman Spectroscopy – Chemical Information • Raman bands can provide structural information (presence of functional groups). • Raman spectroscopy can be used to measure bands of symmetric linkages which are weak in an infrared spectrum (e.g. -S-S-, -C-S-, -C=C-). • The standard spectral range reaches well below 400 cm-1, making the technique ideal for both organic and inorganic species.
Advantages of Raman Spectroscopy – Ease of Use for Process Measurements • Fiber optics (up to 100's of meters in length) can be used for remote analyses. • Purging of sample chamber is unnecessary since Water and CO2 vapors are very weak scatterers. • Little or no sample preparation is required • Water is a weak scatterer - no special accessories are needed for measuring aqueous solutions • Inexpensive glass sample holders, non-invasive probes and immersion probes are ideal in most cases
Disadvantages of Raman Spectroscopy • Inherently not sensitive (need ~ 1 million incident • photons to generate 1 Raman scattered photon) • Fluorescence is a common background issue • Typical detection limits in the parts per thousand • range • Fluorescence Probability versus Probability of • Raman Scatter ( 1 in 103-105 vs 1 in 107-1010) • Requires expensive lasers, detectors and filters. • Small sample volume can make it difficult to obtain • a representative sample.
Complementary Nature of IR and Raman Spectroscopy • IR absorption intensities are proportional to the change in dipole moment as the molecule vibrates. • Raman scattering intensities are proportional to the change in molecular polarizabilities upon vibrational excitation. • For molecules with a center of inversion IR and Raman and mutually exclusive.
Need to emphasize complementarity with more specific examples.
hILN(0-)4 243 [45(a')2+7(a')2] = IR (1-e-h/kT) (45)(32)c4 Placzek's Equationfor Raman Scattering Intensity • IRproportional to IL • IRproportional to N • IR stronger at shorter wavelength • Statistical factor: (1-e-h/kT) Where c = speed of light h = Planck's constant IL = laser intensity N = number of scattering molecules = molecular vibrational frequency in Hz L = laser excitation frequency, in Hz = reduced mass of the vibrating atoms k = Boltzmann's constant T = absolute temperature a' = mean value invariant of the polarizability tensor a' = anisotropy invariant of the polarizability tensor courtesy Kaiser Optical Systems
Analytical Raman Spectroscopy Il=sLCI Il = Raman intensity s = Raman cross section L = Pathlength C = Concentration I = Instrument parameters Sample courtesy Kaiser Optical Systems
Raman Scattering is Stronger from Some Vibrations than from Others • 3N-6 vibrations possible, many have no Raman bands • Change in polarizability during a molecular vibration leads to Raman scattering. • Covalent bonds more polarizable than ionic bonds • Intensity from stretching vibration increases with bond order • Intensity tends to increase with increasing atomic number • Symmetry-forbidden vibrations Adapted from Kaiser Optical Systems slide
Raman Scattering is Stronger from Some Vibrations than from Others • Stretching bands often stronger than bending ones • Symmetric bands often stronger than anti-symmetric ones • Crystalline materials often have stronger Raman bands than non-crystalline materials Adapted from Kaiser Optical Systems slide
Fluorescence • Properties • Very efficient conversion of laser photons into unwanted light • Emission spectrum usually changes little, if at all, with changing laser wavelength • Fluorescence lifetime typically 1 to 10 nanoseconds • Sources • impurities • additives • Elimination • Near-infrared wavelength excitation • Far-UV wavelength excitation • Photobleaching • Spectral subtraction methods • Time-resolved detection Fluorescence Energy Level Diagram Energy Two photon Anti- Stokes Stokes Slide Courtesy of Kaiser Optical Systems
Example of a Raman Spectrum 4 component mixture: omp-xylene and ethylbenzene m, e 6 4 o m, e m p, e Intensity in detected photons x10-5 o ompe p omp 2 m o m e o p p p e 0 400 600 800 1000 1200 1400 1600 1800 Raman shift in wavenumbers from the laser line Slide Courtesy of Kaiser Optical Systems
Glass/Amorphous Materials • Stress on molecular groups from local environment changes vibrational energy. • Discrete peaks become broad bands. Slide Courtesy of Kaiser Optical Systems
Polarizability changes add together X X X X X X X X X X Polarizability changes cancel out X X X X X X X X X X Raman Scattering from Crystals • Periodicity of a crystalline lattice reduces the number of vibrations that Raman observes. • Spectrum consists of narrow peaks. • Spectrum effected by orientation Slide Courtesy of Kaiser Optical Systems
anhydrous monohydrate 1941.9 1800 1700 1600 1500 1400 1300 1200 1100 1000 900 793.5 Raman Shift / cm-1 Theophylline Anhydrous vs. Monohydrate Slide Courtesy of Kaiser Optical Systems, work by Lynne Taylor’s group,. Industrial & Physical Pharmacy, Purdue University
Theophylline Phase Stability as a Function of Temperature 48°C 54°C Intensity 58°C 64°C 69°C 1816.1 1700 1600 1500 1400 1300 1200 1100 1000 877.4 Raman Shift / cm-1 Literature Transition temperature for hydrate to anhydate is around 60°C Slide Courtesy of Kaiser Optical Systems
Components of a Raman Spectrograph • Laser • Fiber optic sampling device • Notch filter • Grating • CCD Detector Slide Courtesy of Kaiser Optical Systems
RamanRxn1 Schematic Overview ProbeHead Control Electronics TE Cooled CCD Detector ProbeHead Invictus NIR Laser Imaging Spectrograph Filtering Universal ProbeHead Immersion and Non-Contact Sampling Optics HoloPlex Notch Slit Axial Transmissive Spectrograph Invictus NIR Laser HoloPlex Grating TE Cooled CCD Detector Slide Courtesy of Kaiser Optical Systems
Output Plane Multi-element Lenses Holographic Transmission Grating Entrance Slit Axial Transmissive Design • HoloPlex Advantages: Quantitative Raman! • Full Simultaneous Spectral Coverage • High Throughput • High Spectral Resolution • No Moving Parts • Low 1.8 f/#meansHigher Optical Throughput (~4X) • Improved Thermal Stability (5X) • Rugged Compact Design Innovative all refractive design! Slide Courtesy of Kaiser Optical Systems
Lasers Commonly used for Raman • 1064 nm • Nd:YAG laser • FT Instrumentation • Out of range of CCD, must use InGaAs or Ge • 830 nm • Not common but could help avoid fluorescence • 785 nm • Diode laser • Most common laser used for Raman work • Good compromise between fluorescence and Raman efficiency…makes it somewhat universal • Stable to environment • Electronically efficient Slide Courtesy of Kaiser Optical Systems
Lasers Commonly used for Raman • 633 nm • He-Ne laser • Longer lifetime • 532 nm • Frequency doubled Nd:YAG laser • Good efficiency, low power • Watch out for fluorescence! • Sensitive to temperature • 514 nm • Ar-ion laser • 488 nm • Ar-ion laser • UV lasers • Resonance Raman • EXPENSIVE Slide Courtesy of Kaiser Optical Systems
Sampling Options Stream Stream Immersion Probe Non-Contact Optic Pilot Plant Trial Production Installation 532 nm excitation Slide Courtesy of Kaiser Optical Systems
Purpose of Notch Filters • Filter out non-informative radiation • In the case of Raman instrumentation, this means filtering the Rayleigh scattered energy • Holographic notch filters are the most common…in nearly every Raman instrument you will find a Kaiser notch filter Slides by courtesy of: Mark Kemper, kemper@kosi.com
Properties of Holographic Notch Filters • High attenuation • Narrow bandwidth • Sharp spectral edges • Good transmission • High damage threshold • Environmentally stable 80 40 % Transmission 0 700 720 740 760 780 800 820 840 Wavelength (nm) Center = 785 nm FWHM at 50%T = 12 nm 0.3 to 4.0 OD edge = 7.1 nm Slide Courtesy of Kaiser Optical Systems
CCD Detector • Multi element silicon detector (1024 x 128) • Maintained at low temperature (-40ºC) • Key reason for lack of moving parts • High sensitivity • Detection range 400 – 1050 nm Slides by courtesy of: Mark Kemper, kemper@kosi.com
To learn more about Raman Spectroscopy: • E. Smith and G. Dent, “Modern Raman Spectroscopy A Practical Approach”, John Wiley & Sons Ltd; (Chichester, United Kingdom), 2005.
Comparing FT-IR and Raman • FT-IR • Absorption • Fundamental information • Sample preparation • Process measurements difficult • High spectral density • Organics • Dipoles • O-H, C=O, N-H • Water a problem • Raman • Emission • Fundamental information • No sample preparation • Process measurements • High spectral density • Sampling challenges • Organics and inorganics • Polarizability • Aromatics, C=C • Water no problem Slide courtesy Kaiser Optical Systems.