Download

1 / 43
450 likes | 524 Vues
North American Hydroclimatology (I) The nature of hydrologic variables. Xiaogang Shi and Dennis P. Lettenmaier. Hydro Group Seminar September 12, 2007. Hydroclimatology The study of water in the atmosphere and on the land -David R. Legates. Outline. Long term water budget;

E N D
North American Hydroclimatology (I) The nature of hydrologic variables Xiaogang Shi and Dennis P. Lettenmaier Hydro Group Seminar September 12, 2007
Hydroclimatology The study of water in the atmosphere and on theland -David R. Legates
Outline • Long term water budget; • Atmospheric moisture transport and recycling; • Spatial and temporal patterns of precipitation; • Regional distribution and temporal trends of snow; • Spatial distributions of soil moisture; • Spatial and temporal distribution of streamflow
Hydrologic Variables in the water budget • Precipitation; • Evapotranspiration (ET); • Streamflow; • Storage terms: • Soil moisture • Snow • Groundwater • Lake, wetland, reservoir • Glaciers and ice sheets
Land surface water balance E P R where Ws represents the water storage; P is Precipitation; E is Evapotranspiration; R is Runoff. Schematic of land surface water balance
Atmospheric water balance where is the horizontal divergence of atmosphere moisture; Wa is total column water flux in the atmosphere Schematic of atmospheric water balance
E P R Long term water balance (Su el al. 2006) For long-term means, the change of the annual mean atmospheric water vapor, soil moisture, and other variables, can be neglected. So the atmospheric flux convergence should be balanced by runoff. Schematic of hydrological cycle
Ocean Atmospheric moisture transport and recycling 1.The ocean is the primary source of atmospheric moisture, accounting for about 85% of all evaporation worldwide. 2. Atmospheric moisture is transported horizontally by the wind, often traveling great distances before precipitating. Along with the local evaporation (or ET), they play an important role on the contributions of precipitation (Source: NOAA) 1. The evaporation of surface moisture 2. Convergence of the moisture advection over a long period
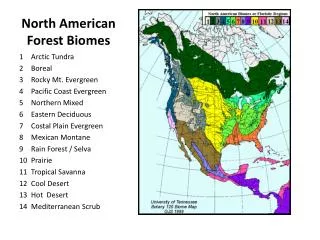
Atmospheric moisture source regions (Source: UCSB) 1. Maritime tropical – Caribbean or subtropical Pacific source region Warm and humid, can produce heavy rains 2. Continental tropical - southwestern desert source regions Hot and dry 3. Maritime polar - North Pacific or North Atlantic source regions Cool and moist, follows typical cold front into California 4. Continental polar and Arctic - Canadian source region Cold and dry, especially in winter. Responsible for outbreaks of severe cold weather throughout eastern US
North American Monsoon North American Monsoon is experienced as a pronounced increase in rainfall from extremely dry May to rainy June–July–August–September (JJAS) monsoon season Annual Rainfall Contributions of the North American Monsoon: NW Mexico: 60-80% Arizona: 35% New Mexico: 45% ( Comrie & Glenn, 1998 ) (Source: NOAA)
Schematic illustration of North American Monsoon system The shading area indicates precipitation and block arrows indicate convergence zones. Small arrows show low-level winds, and thick arrows represent low-level jets. One explanation is that it is caused by large-scale land-sea surface temperature contrasts, as well as by land-atmosphere interactions related to elevated terrain and land surface conditions (e.g. soil moisture and vegetation). (Source: NOAA)
Atmospheric moisture recycling ratio Recycling ratio: how much evaporation in an area contributes to the precipitation in the same area. (Trenberth 1999)
North American annual mean recycling ratio For annual mean conditions, the recycling ratio ( 8 ~ 20 %) for L = 1000 km over land. (Trenberth 1999)
Sources of moisture in MacKenzie (MAGS) and Mississippi River basin (MRB) MAGS: 1. NPO 2. MAGS 3. CAN 4. ASA (Bosilovich el al. 2006) MRB: 1.MRB 2. USMEX 3. NPO 4. GOM 5. NTA 6. CAR
Basin-averaged major moisture sources of precipitationfor MAGS 1. The North Pacific Ocean’s (NPO) source dominates in winter and the other continental sources play a role in summer. 2. Maximum moisture recycling period is May–July (MJJ) (Bosilovich el al. 2006)
Moisture balance during May–July (MJJ) for MAGS 1. The recycling ratio is 19.6%, meaning that 0.37 mm/day of the water precipitating has come from evaporation (total precipitation is 1.9 mm/day). 2. Szeto (2002) computed the recycling ratio for MAGS to be 25%. (Bosilovich el al. 2006) The amount of water from NPO almost doubles the local source during May–July (MJJ). However, other land areas including the rest of Canada, and even Asia, also provide significant sources.
Basin-averaged major moisture sources of precipitationfor MRB 1. The MRB also has a a clear annual cycle of precipitation recycling with a maximum in MJJ. 2. The moisture sources from MRB dominate precipitation recycling in the summer time. (Bosilovich el al. 2006)
Moisture balance during May–July (MJJ) for MRB 1. The recycling ratio is 23.4%. 2. Trenberth (1999) computed the recycling ratio for MRB (1800 km scales) to be 21%. (Bosilovich el al. 2006)
Seasonal Cycle of Precipitation (mm day-1) Warm Season May: Heaviest P in the Gulf Coast and lower Mississippi Valley. June:P reaches a maximum over the Central US, while monsoon rainfall spreads northward along the western slopes of the Sierra Madre. July:Monsoon P shifts northward into AZ/NM by early July while P decreases in Central US. August:Monsoon P reaches a maximum over SW and then starts to retreat. September – October:Monsoon P retreats gradually from SW to Mexico. In October, the SW are drier while P increases in the PNW and the north of California. Plots courtesy NARR
Seasonal Cycle of Precipitation (mm day-1) Cold Season Nov-Dec Precipitation extends from the Pacific Northwest southward to California Jan- Feb Rainy season in PNW and California. The P increases in lower Mississippi Valley March-April Rainfall retreats northward and lower Mississippi Valley becomes drier. The precipitation spreads out the central US and retreats gradually from PNW and California.
Spatial distribution of precipitation trends (1900-2005) Green shades indicate a trend towards wetter conditions over the period, and brown shades indicate a trend towards dryer conditions. over the U.S., total annual precipitation increased at an average rate of 6.1 percent per century since 1900, although there was considerable regional variability. The greatest increases came in the East North Central climate region (11.6 percent per century) and the South (11.1 percent). Hawaii was the only region to show a decrease (-9.25 percent) Data courtesy National Climatic Data Center
Spatial and temporal characteristics of heavy precipitation events over Canada 38 30 (Zhang et al., 2001a) The trends in the fraction of annual precipitation occurring in the largest 10% of daily events with measurable precipitation as derived from 68 adjusted Canadian stations. Over a large portion of the country, there is a upward trend over the last 46 yr. It is clearly evident that the upward trend since 1940 was dominated by the 38 short record stations. The majority of these stations are clustered in northern Canada.
Increased heavy precipitation in USA Trends (1910–95) related to the highest daily precipitation amount averaged throughout the year; Trends are expressed as a percentage of the overall mean of the highest daily year-month precipitation amount. Statistically significant trends are highlighted. The national trend is statistically significant at the a = 0.05 level for the highest daily year-month values. Karl et al. 1998
North American snow cover distribution • MODIS snow maps represent maximum snow cover in North America during the same 8-day period (January 17-24) in each of four consecutive years (2001-2004). • 2. Though this 8-day period is not necessarily representative of the entire winter, the maps reveal that snow cover duration is variable in both space and time. (Source: NASA)
Snow Data (T. Mote, 2004) • 1 by 1 interpolated snowfall data • interpolated from U.S. National Weather Service (NWS) cooperative stations and the Canadian daily surface observations • The period of record is 1900-2000 with a daily resolution
Temporal trends of snowfall • Snowfall records from observations from 1949 to 2004 at NCDC COOP stations. • 2. The ratio of winter snowfall liquid water equivalent (SFE) to winter total precipitation (P) has changed (SFE/P). November-March SFE/P has decreased over the vast majority of stations across the West, although results are somewhat mixed over the interior west including Colorado, Utah and Wyoming • 3. Most of the significant changes in SFE were found to be unrelated to changes in total precipitation, so the proportion of winter precipitation falling as rain must have increased during this period. Knowles et al.2006
Temporal trends in SWE (Snow Water Equivalent) • Decreases in April 1 SWE between 1950-1997 at the majority of sites; • 2. The largest decreases found in western Oregon and Washington, and northern California; • 3. A number of stations in southern Utah, Colorado and elsewhere in the Southwest, indicated increasing trends in SWE. Mote el al. 2005
…causing soil moisture to increase... …which affects the atmosphere moisture balance Precipitation wets the surface... …which causes evaporation to increase during subsequent days and weeks... land-atmosphere feedback of soil moisture …thereby inducing additional precipitation
Observed ground soil moisture dataset Ground data: Global Soil Moisture Data Bank (upper 5…10cm, point scale, ~10 days) Eurasia USA (Robock et al,2000) Total number = 236 stations in 207 catchments Dot: insufficient data (136) Plus/Circle: catchment included in analysis (71)
Avg. # of SMMR data per month (79-87) SMMR soil moisture dataset SMMR (1978-87): Satellite retrievals (upper 1.25cm, ~140km, ~3 days) SMMR soil moisture not available - under dense vegetation, - close to water surfaces, - in frozen soil. (Owe et al.2001)
Model soil moisture: e.g. North America Regional Reanalysis (NARR) 2. Observed or analyzed gridded data are used to drive the model for a number of months or years. 1. The limitations of observing soil moisture, there have been virtually no datasets of soil wetness produced for the whole North America. So we calculate surface water storage (S; including snowpack where it exists) as an integral of the residual change in a simple water balance relationship. 32 km (NARR)
Model soil moisture of 1993 flood and 1988 drought 1993 1988 Soil moisture availability for Top 1-meter of soil column Average during 16-31 July
The distribution of USGS streamflow gages Nationally, USGS surface-water data includes more than 8000 real-time gages that describe stream levels
Trends (p>0.05) in annual mean daily discharge The systematic decreases are in the Pacific Northwest, Northern California, and parts of the Southeast; a broad area with uptrends stretches from the New England to the Lower Colorado, and Mid-Atlantic, Ohio, Tennessee, Upper and Lower Mississippi, Texas-Gulf, Rio Grande, and Great Basin. (1944-1993) (Lins et al 1999)
Trends in annual daily streamflow 1. A trend of decreasing annual mean streamflow was found across southern Canada. A small increasing trend in the Great Lakes–St. Lawrence region. (Zhang et al., 2001a) 2. The trend in streamflow for the United States during 1948-1988, Lettenmaier et al. showed negative trends in the northwest and positive trends in the middle and northeastern United States. The results are consistent with the trends shown for the 1947-1996 period in Canada (Lettenmaier et al., 1994)
The variations on seasonality and timing of streamflow 1. The research shows the winter flows rise and summer flows drop in the western US. 2. Streamflow in the western US is highly seasonal. Earlier timing of snowmelt – longer summer drought Stewart et al 2004 Climatic Change
Thank You Question? Lake Dillon, Colorado, August 8, 2002