Download

1 / 20
200 likes | 362 Vues
Forecasting Patient Turnaround Times at Concentra Centers. Juan ignacio Barrientos Sajid Islam Alisha Manzo. Summary. Forecasting Difficulties at Concentra Medical Services High levels of uncertainty High variability over many dimensions Data Inputs Center number, date

E N D
Forecasting Patient Turnaround Times at Concentra Centers Juan ignacioBarrientos Sajid Islam Alisha Manzo
Summary • Forecasting Difficulties at Concentra Medical Services • High levels of uncertainty • High variability over many dimensions • Data Inputs • Center number, date • Patient flow by service type, average time • Methodology • Linear Regression analysis • Qualitative Analysis • Analysis of Findings
The Project Company background Defining the project Scope objectives
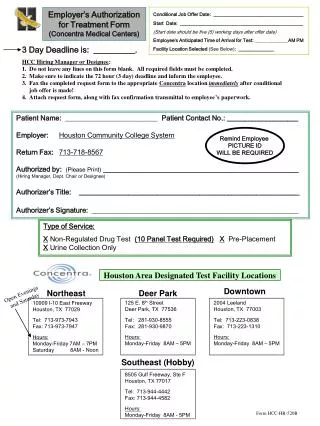
Concentra Background • National outpatient healthcare company based in Addison, TX • 300 medical centers located in 90 cities and 40 states • Their management consists of primary care physicians and physical therapists • These include injuries, illnesses, disease prevention, physical exams, and drug testing.
Defining the Project • Goals: • Model to provide accurate turnaround time for patients visiting the Dallas area clinics. • Why? • Reliable turnaround times set expectations and empower the customer to know what to do with their time. • Customer satisfaction: we want to provide patients with the best experience when visiting Concentra clinics.
Scope • Focus on Dallas, TX centers • Stemmons – 118 patients/day • Live Oak – 87 visits/day • Redbird – 41 visits/day • Analysis six services: • Initial Visit • Recheck Visit • Therapy • Specialist Visit • Physical • Drug Screen
Objectives Minimize inaccuracies and fluctuations with projected waiting times. Reliable forecasting. Build a functional application for forecasting.
Methodology Data analysis Linear Regression equations Building the application Model limitations
Data Analysis • Organize data by date and center. • Remove outliers from data set. • Quartile method. • Perform more accurate statistical analysis. • Final regression line more accurately represents the sample population. • Perform linear regression analysis.
Linear Regression • Plot data points on an X,Y scatter plot • X = independent variable. Number of patients for any given day. • Y = dependent variable. Turnaround time. • Find best fit line for all data points. • Find equation of the line for future forecasting.
Model Limitations • Incomplete data. • Correlation between number of patients and total turnaround time is small. • Other factors are equally important. • Data available only encompassed on year. • Hard to find repetitive patterns that come with seasonal changes. • Model is limited to range of patients that each center was exposed to.
Conclusion Managerial interpretation Recommendations Q&A
Managerial Interpretation We can draw conclusions that patient turnaround times does to some extent depend on the number of patients in the clinic. With respect to the data, our model is the best way to quantitatively predict turnaround time. Data that would be useful would include: staff available on any given day, center capacity, check-in time, total procedure time, and check-out time.
Recommendations • Generate a greater range of data • Arrival Rate • Identify factors contributing to variation in procedure time • Procedure time vs. waiting time • Gather patient information prior to quoting turnaround time • Staff evaluation • Staffing levels at various points in the day • Skill level of staff on hand – equal? • Leveling of staff based on demand forecast per service type