Download
1 / 27
270 likes | 358 Vues
Time Series Analysis of Nutrients on the Lower Mississippi River. 29 September 2004 @ Northeastern U. 41% of Continental US Heavily Farmed Regions(N) 56% of N from 5 states. http://www.epa.gov. Hypoxia. First noticed in 1972 Regular checking since 1985 1 Million Metric Tons Nitrate/year.

E N D
Time Series Analysis of Nutrients on the Lower Mississippi River 29 September 2004 @ Northeastern U.
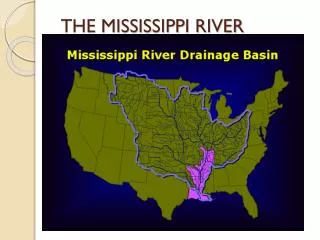
41% of Continental US • Heavily Farmed Regions(N) • 56% of N from 5 states http://www.epa.gov Lower Mississippi Nutrient Time Series
Hypoxia • First noticed in 1972 • Regular checking since 1985 • 1 Million Metric Tons Nitrate/year http://www-personal.umich.edu/~acotel/Webpages/Classwebpages/kirk.ppt Lower Mississippi Nutrient Time Series
Issues & Facts • Anoxic Zone along the Coastal Louisiana waters • Nitrate • Ammonia • Phosphorus • Orthophosphate • Causes • Fertilizer application • Hydrological changes Lower Mississippi Nutrient Time Series
Time Series • What is it? • An ordered sequence of values of a variable at equally spaced time intervals. • Time Series Modeling • accounts for the fact that data points taken over time may have an internal structure (such as autocorrelation, trend or seasonal variation) that should be accounted for. • Yt = Trend + Seasonal + Irregular • Trend: Tt = 5 + 0.1t • Seasonal: St = 2.6 Sin(t/2) • Irregular: It = 0.4 It-1 + Єt Lower Mississippi Nutrient Time Series
Methodology • Summary Statistics • Pretreatment / Missing Values • Trend Analysis • Seasonality • SARIMA • ARCH-GARCH Models • VAR Models • Forecasting Lower Mississippi Nutrient Time Series
Summary Statistics & Data Pretreatment • Summary of Statistics • Number of data, Missing values • Mean, Variance • Maximum, Minimum • Skewness , Kurtosis • Data Pretreatment • Outliers • Transformation • Treatment of Missing Values Lower Mississippi Nutrient Time Series
Trend Analysis • Trend: • A long term movement in a time series. It is the underlying direction (an upward or downward tendency) and rate of change in a time series • Deterministic • Stochastic • Two Tests • Kendell-Tau Test • Dicky-Fuller Test • Trend Fitting / Removal as a part of modeling • Differencing • Detrending Lower Mississippi Nutrient Time Series
Seasonality • Seasonality: • mean periodic fluctuations in the data • Hourly, Daily, Monthly, Annual • Identification • Spectral Analysis [Frequency Domain] • Auto Correlation Function (ACF) & Partial Auto Correlation Function (PACF) [Time Domain] Lower Mississippi Nutrient Time Series
SARIMA Models • SARIMA Models • Seasonal AutoRegressive Integrated Moving Average • SARIMA(p,d,q)(P,D,Q)s • p & q = the nonseasonal coefficients • d = number of nonseasonal differences • P = number of multiplicative autoregressive coefficients • D = number of seasonal differences • Q = number of multiplicative moving average coefficients • s = seasonal period Lower Mississippi Nutrient Time Series
SARIMA Models (Cont.) • ARMA model ARMA(p,0,q) • yt = α0 +Σαi yt-i + Σβi εt-i Where:α0 a constant (intercept) αi the autoregressive model parameters βi the moving average model parameters εt-i white noise (residual OR error) Lower Mississippi Nutrient Time Series
SARIMA Models (Cont.) • Model Selection Criteria • Akaike Information Criterion • AIC = T*ln(residual sum of squares)+2*n • Schwartz Bayesian Criterion • SBC = T*ln(residual sum of squares)+n*ln(T) • Q-Statistic Where T = number of usable observations n = number of parameters estimated Lower Mississippi Nutrient Time Series
ARCH & GARCH • Residuals in SARIMA Models assume • Zero mean • Homoskedasticity: constant variance • GARCH model • Generalized AutoRegressive Conditional Heteroskedastic • extracts information from the residual variance • Modeled after the SARIMA model Lower Mississippi Nutrient Time Series
VAR Models • Models with other variables in the models • Transfer function models • No feedback to Independent variable • VAR (Vector AutoRegression) models • No independent variable (Feedback from one to another) • VAR Analyses & models • Impulse Response Analysis • Structural VARs & Multivariate decompositions • Granger Causality • To decide the “independent” variable components Lower Mississippi Nutrient Time Series
VAR Models (Cont.) • Standard VAR Form • Forecast error variances • in {eyt} • in {ezt} Lower Mississippi Nutrient Time Series
VAR Models (Cont.) • Impulse Response Functions • VAR Form 1 (Analogous to an AR(1) model) • VAR Form 2 (Analogous to a MA model) Lower Mississippi Nutrient Time Series
Study Data • USGS Station @ Tarbert Landing (River Mile 308) • Daily Flow • Jefferson Parish Water Works (River Mile 100) • Daily Nitrate Concentration • Daily Ammonia Concentration • Daily Phosphorus Concentration • Daily Orthophosphate Concentration • Time Travel Model for Flow from RM 308 to RM 100 Lower Mississippi Nutrient Time Series
Data (Cont.) • Summary Table • Data Analysis • Weekly • Monthly • Quarterly Lower Mississippi Nutrient Time Series
Results Lower Mississippi Nutrient Time Series
Results (Cont.) • 40% missing values in Ammonia weekly data • No Significant Trend in • Monthly data & • Quarterly data • Annual seasonality according to • Spectral Analysis • ACF-PACF plot Lower Mississippi Nutrient Time Series
Results (Cont.) Monthly Nitrate/ACF-PACF Plot Lower Mississippi Nutrient Time Series
Results (Cont.) Monthly SAR Model Quarterly SAR Model • No significant improvement with ARCH models Lower Mississippi Nutrient Time Series
Results (Cont.) VAR Models for Monthly data • The numbers in brackets are the specific time lag for that endogenous variable • The other number in the cell is the value of the coefficient for that time lagged variable • Impulse Response Functions (for monthly data) show • A shock to Nitrate had negligible effect on the flow • A shock to Nitrate had a 3 month effect on the nitrate • A shock to flow had a 3 month effect on the flow • A shock to flow had the peak effect on the nitrate at the 3rd month Lower Mississippi Nutrient Time Series
Results (Cont.) Lower Mississippi Nutrient Time Series
Results (Cont.) Lower Mississippi Nutrient Time Series
Results (Cont.) Lower Mississippi Nutrient Time Series
Conclusions & Future Research • Conclusions • No significant trend found • Annual seasonality • No improvement with ARCH models • Shocks on Nitrate had negligible effect on flow • Shocks on Flow had significant effect on Nitrate • Future Research • GARCH & VAR models • for Lake data • for other water quality parameters in rivers Lower Mississippi Nutrient Time Series