Download
1 / 71
800 likes | 1.15k Vues
Measuring Gene Expression. David Wishart Bioinformatics 301 david.wishart@ualberta.ca Notes at: http://wishartlab.com. Assignment Schedule. Gene finding - genome annotation (Assigned Oct. 31, due Nov. 7) Microarray analysis (Assigned Nov. 7, due Nov. 19) Protein structure analysis

E N D
Measuring Gene Expression David Wishart Bioinformatics 301 david.wishart@ualberta.ca Notes at: http://wishartlab.com
Assignment Schedule • Gene finding - genome annotation • (Assigned Oct. 31, due Nov. 7) • Microarray analysis • (Assigned Nov. 7, due Nov. 19) • Protein structure analysis • (Assigned Nov. 21, due Nov. 28) Each assignment is worth 5% of total grade, 10% off for each day late
How To Do Your Assignment • Is this a eukaryote, prokaryote, virus, mix? • Use several methods to find genes or predict proteins – BLASTX is best but it helps to run other gene prediction tools if the organism contains novel genes or gene fragments • Once you have found your genes/proteins then start running some annotation tools – one protein at a time. Don’t use BASYS. Try using PROSITE, PSI-BLAST, PPT-DB, Proteus2, PDB to figure out what these proteins might be. Use pictures & graphs
How To Do Your Assignment • Gather as much information about each protein/gene as possible and show its gene/protein sequence, where it is located in the genome (position), what it might look like, its functional sites, etc. (look at the data in CCDB or GeneCards to see how you should annotate each gene/protein) • Some of the proteins may be familiar or similar to something else others will be totally weird. Use PubMed or other databases to figure out how some of the proteins you’ve identified may lead to disease. Explain how they may work
How To Do Your Assignment • The assignment should be assembled using your computer (cut, paste, format and edit the output or data so it is compact, meaningful and readable – consider tables) • No handwritten materials unless your computer/printer failed • A good assignment should be 8-10 pages long and will take 5-6 hours to complete • Hand-in hard copy of assignment on due date. Electronic versions are accepted only if you are on your death bed
Objectives • Review different methods to measure gene expression • Understand the differences in methods and reliability • Understand basic principles of DD, SAGE, RNA-Seq, RT-PCR, Microarrays • Understand some of the limitations of Microarray measurements
Outline for Next 3 Weeks • Genes and Gene Finding (Prokaryotes) • Genes and Gene Finding (Eukaryotes) • Genome and Proteome Annotation • Measuring Gene Expression • Introduction to Microarrays • More details on Microarrays
Looking at Genes* • Where? (where are genes located?) • Genes are located using gene finding programs (Glimmer, Genscan) • What? (what do these genes do?) • Genes are characterized using gene annotation tools (BaSys etc.) • How Many? (how abundant are they?) • Gene expression is measured experimentally using SAGE or gene chips
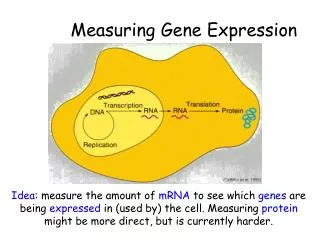
Different Kinds of “Omes” • Genome • Complement of all genes in a cell, tissue, organ or organism • Transcriptome • Complement of all mRNA transcripts in a cell, tissue, organ or organism • Proteome • Complement of all proteins in a cell, tissue, organ or organism
Different Kinds of “Omes”* Genome Transcriptome Proteome
The Measurement Dichotomy* Less Easy DNA RNA Ease of measurement Biological relevance protein metabolite Hard More phenotype
High Throughput Measurement Easy Genomics DNA Transcriptomics RNA Ease of measurement protein Proteomics metabolite Metabolomics, Phenomics (etc.) Hard phenotype
-Omics Mania biome, CHOmics, cellome, cellomics, chronomics, clinomics, complexome, crystallomics, cytomics, cytoskeleton, degradomics, diagnomicsTM, enzymome, epigenome, expressome, fluxome, foldome, secretome, functome, functomics, genomics, glycomics, immunome, transcriptomics, integromics, interactome, kinome, ligandomics, lipoproteomics, localizome, phenomics, metabolome, pharmacometabonomics, methylome, microbiome, morphome, neurogenomics, nucleome, secretome, oncogenomics, operome, transcriptomics, ORFeome, parasitome, pathome, peptidome, pharmacogenome, pharmacomethylomics, phenomics, phylome, physiogenomics, postgenomics, predictome, promoterome, proteomics, pseudogenome, secretome, regulome, resistome, ribonome, ribonomics, riboproteomics, saccharomics, secretome, somatonome, systeome, toxicomics, transcriptome, translatome, secretome, unknome, vaccinome, variomics... http://www.genomicglossaries.com/content/omes.asp
Why Measure Gene Expression?* • Assumption that more abundant genes/transcripts are more important • Assumption that gene expression levels correspond to protein levels • Assumption that a normal cell has a standard expression profile/signature • Changes to that expression profile indicate something is happening
Why Measure Gene Expression?* • Gene expression profiles represent a snapshot of cellular metabolism or activity at the molecular scale • Gene expression profiles represent the cumulative interactions of many hard to detect events or phenomena • Gene expression is a “proxy” measure for transcription/translation events
mRNA level = Protein level?* • Gygi et al. (1999) Mol. Cell. Biol. compared protein levels (MS, gels) and RNA levels (SAGE) for 156 genes in yeast • In some genes, mRNA levels were essentially unchanged, but protein levels varied by up to 20X • In other genes, protein levels were essentially unchanged, but mRNA levels varied by up to 30X
SAGE vs. 2D Gel mRNA Protein
mRNA level = Protein level?* Gygi et al. (1999) Mol. Cell. Biol R = 0.35 R = 0.95
mRNA level = Protein level? • Griffen TJ et al. (2002) Mol. Cell. Proteomics 1:323-333 • Compared protein levels (MS, ICAT) and RNA levels (microarray) for 245 genes in yeast on galactose/ethanol medium • “Significant number of genes show large discrepancies between abundance ratios when measured at the levels of mRNA and protein expression”
Microarray vs. ICAT* mRNA Protein
mRNA vs. Protein levels* Griffen TJ et al. (2002)
mRNA vs. Protein levels Griffen TJ et al. (2002)
Why Do It? Easy Genomics DNA Transcriptomics RNA Ease of measurement protein Proteomics metabolite Metabolomics, Phenomics (etc.) Hard phenotype It’s easier to do than the other measurements
How Relevant are RNA Levels to Protein Levels? “ [transcript abundance] doesn’t tell us everything, but it tells us a lot more than we knew before ” --Pat Brown, Stanford Microarray pioneer
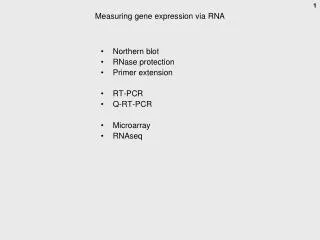
Measuring Gene Expression* • Differential Display • Serial Analysis of Gene Expression (SAGE) • RNA-Seq • RT-PCR (real-time PCR) • Northern/Southern Blotting • DNA Microarrays or Gene Chips
Differential Display (DD)* • Basic idea: • Run two RNA (cDNA) samples side by side on a gel • Excise and sequence bands present in one lane, but not the other • The clever trick: • Reduce the complexity of the samples by making the cDNA with primers that will prime only a subset of all transcripts
Differential Display (Detail) Prime with polyT Prime with C(polyT) TAAAAAn TAAAAAn GAAAAAn GAAAAAn CAAAAAn CAAAAAn TAAAAAn TAAAAAn
Differential Display (Detail) prime with polyT prime with C(polyT) TAAAAAn TAAAAAn TTTTTn GAAAAAn GAAAAAn CTTTTTn TTTTTn CAAAAAn CAAAAAn TTTTTn TAAAAAn TAAAAAn TTTTTn Less complex cDNA mixture Complex cDNA mixture
Differential Display 10hr 11hr 12hr 16hr
Advantages of DD* • Oldest of all transcript expression methods • Technically and technologically simplest of all transcript methods • Does not require ESTs, cDNA libraries, or any prior knowledge of the genome • Open-ended technology
Disadvantages of DD* • Not very quantitative • Sensitivity can be an issue • Only a fraction of the transcripts can be analyzed in any single reaction • Prone to false positives • Not easily automated or scaled-up
SAGE* • Principle is to convert every mRNA molecule into a short (10-14 base), unique tag. Equivalent to reducing all the people in a city into a telephone book with surnames • After creating the tags, these are assembled or concatenated into a long “list” • The list can be read using a DNA sequencer and the list compared to a database to ID genes or proteins and their frequency
SAGE* Convert mRNA to dsDNA Digest with NlaIII Split into 2 aliquots Attach Linkers
SAGE* Linkers have PCR & Tagging Endonuclease Cut with TE BsmF1 Mix both aliquots Blunt-end ligate to make “Ditag” Concatenate & Sequence
Advantages of SAGE* • Very direct and quantitative method of measuring transcript abundance • Open-ended technology • Near infinite dynamic range • Built-in quality control: • e.g. spacing of tags & 4-cutter restriction sites
Disadvantages of SAGE* • Expensive, time consuming technology - must sequence >50,000 tags per sample (>$5,000 per sample) • Most useful with fully sequenced genomes (otherwise difficult to associate 15 bp tags with their genes) • 3’ ends of some genes can be very polymorphic
Advantages of RNA-Seq* • Very direct and quantitative method of measuring transcript abundance • Open-ended technology • Near infinite dynamic range • No prior knowledge of genome required • Discriminates among regions with high sequence identity
Disadvantages of RNA-Seq* • Expensive equipment (instruments are >$500,000) • Expensive to run (at least for now) • Amplification steps can distort the balance between abundant and rare RNA species • Selection and hybridization methods may introduce artifacts • Software is still evolving/improving
Principles of PCR* Polymerase Chain Reaction
PCR Tools Thermocycler Oligo Synthesizer
Reverse Transcriptase PCR* • Two kinds of “RT-PCR” - confusing • One uses reverse transcriptase (RT) to help produce cDNA from mRNA • Other uses real time (RT) methods to monitor PCR amplification
RT-PCR* • RT (Real Time) PCR is a method to quantify mRNA and cDNA in real time • A quantitative PCR method • Measures the build up of fluorescence with each PCR cycle • Generates quantitative fluorescence data at earliest phases of PCR cycle when replication fidelity is highest
RT-PCR (Taqman)* An oligo probe with 2 flurophores is used (a quencher & reporter)
Advantages of RT-PCR* • Sensitive assay, highly quantitative, highly reproducible • Considered “gold standard” for mRNA quantitation • Can detect as few as 5 molecules • Excellent dynamic range, linear over several orders of magnitude