Download
1 / 31
310 likes | 443 Vues
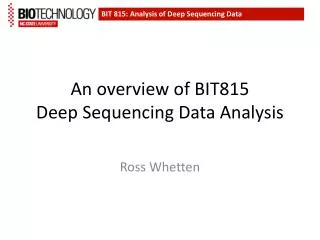
BIT 815: Analysis of Deep Sequencing Data. Overview:

E N D
BIT 815: Analysis of Deep Sequencing Data • Overview: • This course will cover methods for analysis of data from Illumina and Roche/454 high-throughput sequencing, with or without a reference genome sequence, using free and open-source software tools with an emphasis on the command-line Linux computing environment* • Lecture Topics: • Types of samples and analyses • Experimental design and analysis • Data formats and conversion tools • Alignment, de-novo assembly, and other analyses • Computing needs and available resources • Annotation • Summarizing and visualizing results Labs: Lab sessions meet in a computing lab, and will provide students with hands-on experience in managing and analyzing datasets from Illumina and Roche/454 instruments, covering the same set of topics as the lectures. Example datasets will be available from both platforms, for both DNA and RNA samples; students who have their own datasets may contact the instructor prior to the course to discuss opportunities for analysis of their data during the lab sessions. * see http://www.physics.ubc.ca/mbelab/computer/linux-intro/html/ for an overview
Introduction to the course and to each other • - background in biology, computing, and sequencing • - experiments of interest to participants • Course structure • - 3 two-hour blocks per week • * ~ 45 min lecture/discussion • * ~ 70 min lab exercises • - some assigned reading • - participation in classroom discussion is expected • - no exams • Course Objective • - to teach you how to teach yourself
The sequencing rate is growing faster than Moore’s Law Stein (2010) Genome Biology 11:207
Sequence data analysis is changing rapidly • - relatively few methods are completely static • - much of the software is still under active development • - new methods and tools are reported every month • - staying on the learning curve is essential • Why use Linux for sequencing data analysis? • - it is well-suited to the task • * preferred development platform for most tools • * modular design • * built for speed, not for comfort
Modular design in Linux – a ‘toolbox’ approach • Individual components of the Linux operating system are written as separate programs • Different programs can have similar functions • A Linux “distribution” is a collection of programs that work together as an operating system • Users have the power to add new programs, or take away existing programs that are not being used, to optimize system performance
Why is modularity an advantage? • - adding new software is relatively straightforward • - the operating system can be continually upgraded • - adding tools to the toolbox • - staying on the learning curve • There is always more than one way to do it • - some sequence analysis tasks have matured to stability • - most have not, and are still changing • - ‘best practices’ are also changing, and subject to dispute
Linux distributions • - collections of ‘tools’ targeted to different user groups • - some are commercial, most are not • - five or six account for most of the users • - many dozens of variants available, mostly of minor interest • Which to use for sequencing data analysis? • - Ubuntu • * widely-used distributionwith good hardware support • * base for Bio-Linux, with pre-installed bioinformatics packages • * Bio-Linux is also available as an Amazon EC2 machine image for cloud computing
Virtual Computing Laboratory • - NC State resource for computing needs • - provides access to ‘virtual machines’ for campus users • - a VM is an ‘instance’ of a ‘machine image’ • - the underlying image is the same for every instance • - user-generated files are lost when the instance terminates • Using the VCL for this course • - NC State is collaborating with Red Hat • * CentOS is a distributionbased on Red Hat • * I created a machine image on the VCL based on CentOS • * The DeepSeqAnalysis image will be our platform for this course
Choose the DeepSeqAnalysis machine image,set the time to the length of the class period
Sequencing technology overview • - Two different systems on campus: IlluminaGAIIx, 454 • - A similar overall strategy for highly-parallel sequencing • - Different approaches taken at virtually every step • - These different platforms produce data with different characteristics • - Other platforms are available off-campus, but are not a focus of the course • Similarities • - DNA molecules are fragmented and ligated to adaptors • - individual DNA molecules are immobilized on a surface • - a series of nucleotide addition reactions are carried out • - the nucleotide added is detected after each addition • - a data file is produced containing the DNA sequences of many fragments
Sequencing technology overview - 454 DNA fragmentation – usually sonication Adaptor oligonucleotide addition Images from www.454.com
Sequencing technology overview - 454 A single molecule immobilized on a bead PCR amplification in oil-water emulsion creates ~10 million copies per bead Images from www.454.com
Sequencing technology overview - 454 DNA-containing beads deposited in wells “Pyrosequencing” produces light when anyof PicoTiterPlate , along with smaller beads nucleotide is incorporated, so only a single with immobilized enzymes for light nucleotide is provided during a cycle, and production light output is recorded during each cycle
Sequencing technology overview - 454 A ‘flowgram’ showing light output from each cycle of base addition one flowgram is produced for each of the ~1 million wells in a PicoTiterPlate TACG ‘key’sequence
Sequencing technology overview – IlluminaGAIIx Illumina uses a glass ‘flowcell’, about the size of a microscope slide, with 8 separate ‘lanes’. The GAIIx instrument focuses the laser and light detection system only on one of the two surfaces inside the flowcell; the new HiSeq instrument scans both surfaces and therefore doubles the yield of sequence data per lane. Additional improvements in scanning and increases in cluster density make the difference closer to 4x or 5x more data from a HiSeq.
Sequencing technology overview – IlluminaGAIIx Fragment DNA, ligate adaptor oligos Single-stranded DNA binds to flowcell surface
Sequencing technology overview – IlluminaGAIIx Surface-bound primers are extended by DNA polymerase across annealed ssDNA molecules,the DNA is denatured back to single strands, and the free ends of immobilized strands annealagain to oligos bound on surface of flowcell. This ‘bridge PCR’ continues until a cluster of~ 1000 molecules is produced on the surface of the flowcell, all descended from the singlemolecule that bound at that site. After PCR, the free ends of all DNA strands are blocked.
Sequencing technology overview – IlluminaGAIIx Another perspective of the amplification process, showing the clusters of products
Sequencing technology overview – IlluminaGAIIx Although four different colors are used for the fluorescent nucleotides, only two lasers are used to excite the fluorescence. The fluorescent labels are grouped in pairs - labels on A and G are excited by one laser, and labels on C and T are excited by the other laser. This means that distinguishing between the A signal and the G signal is more difficult for the instrument than A versus C or A versus T. Base substitution errors are the most common type of sequencing error for Illumina instruments. AGCCG TAAGT GCTGA CTTAG
Understanding FASTQ format, or“what do all these symbols mean?” See http://en.wikipedia.org/wiki/FASTQ_format for more details Instrument ID lane tile X Y barcode read# Header lines sequence quality scores Quality values for sequence data are numbers that represent the probability that the given base call is an error. Because these probabilities are always less than 1, the value is given as the negative log(10) of the probability, multiplied by 10. For example, a probability of 0.001 (1x10⁻³) is represented as a quality score of 30. Computers understand numbers, not letters, so every non-numeric character has a numeric code that the computer uses. These are called the “American Standard Code for Information Interchange”, or ASCII, values. Using characters instead of numbers allows a single character to represent any number between 33 and 126. Unfortunately, at least four different ways of converting numbers to characters are used.
Illuminaflowcell geometry (GAIIx) 1 2 3 4 5 6 7 8 A flowcell has 8 lanes, which are physically separated. Each lane is imaged during each cycle of sequencing in 120 separate images, called ‘tiles’, which are not physically separated. Tiles within a lane are numbered from 1 to 60 down the length of the lane, then from 61 to 120 back up the other side. 1 120 2 119 59 62 61 60
SolexaQA quality checking A program written in Perl (a programming language designed for manipulating text files) that samples a specified number of reads from each tile and calculates a range of summary statistics . Mean quality scores for each cycle are calculated by default; minimum/maximum values and variances can also be calculated if desired. The program returns data in both matrix form and in more visually-informative graphical formats, including a heatmap showing the quality per cycle for every tile and a plot showing the mean quality per cycle for each tile and the global mean quality. A histogram is also returned, showing the distribution of lengths of the longest segment of each read that surpasses a user-specified quality score or error probability threshold (p = 0.05 by default). Another Perl program, DynamicTrim.pl, is provided that will trim the reads to leave only the longest contiguous segment that surpasses the quality threshold, and write the trimmed reads to a new FASTQ-format file for further use.
SolexaQA quality checking An example heatmap output from SolexaQA, from a sequencing run of particularly poor quality. This particular run consists of 75 cycles (shown left to right), and 100 tiles (shown top to bottom. Note that tile 75 failed to yield any sequences that passed the Solexa quality filtering software. The coloring of the heat map is shown as error probability, with the darkest shade indicating p=0.75, the same as random guessing. The quality values clearly differ widely across tiles at cycles after about 25, as well as decreasing within a tile as the cycle number increases. Occasional isolated cycle failures for individual tiles may be the result of a bubble or other problem with reagent flow in the flowcell.
SolexaQA quality checking An example plot from the same dataset, showing the dramatic differences in average quality across tiles (the dotted lines), and the increase in error probability with cycle number.
SolexaQA quality checking The distribution of lengths of longest segments with error probability < 0.05 from the same dataset. This is an unusually poor quality dataset, but illustrates the capabilities of SolexaQA well.