Download
1 / 22
220 likes | 350 Vues
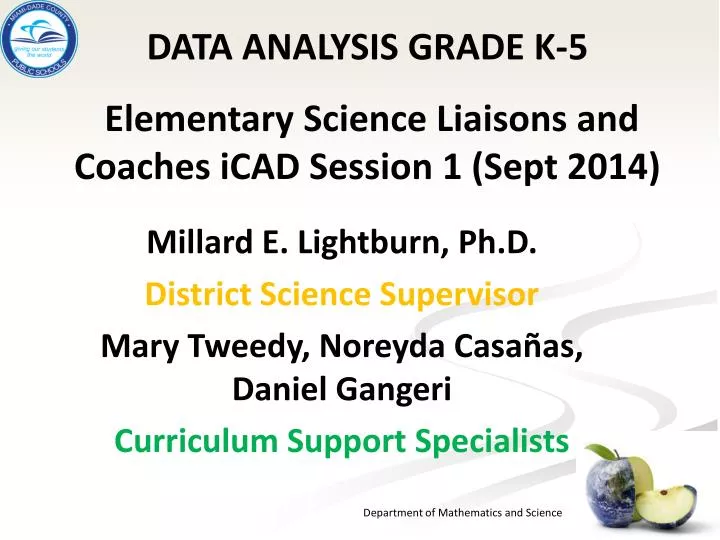
DATA ANALYSIS GRADE K-5 Elementary Science Liaisons and Coaches iCAD Session 1 (Sept 2014). Millard E. Lightburn, Ph.D. District Science Supervisor Mary Tweedy, Noreyda Casañas , Daniel Gangeri Curriculum Support Specialists.

E N D
DATA ANALYSIS GRADE K-5 Elementary Science Liaisons and Coaches iCAD Session 1 (Sept 2014) Millard E. Lightburn, Ph.D. District Science Supervisor Mary Tweedy, NoreydaCasañas, Daniel Gangeri Curriculum Support Specialists
What Kind of Information can Data Provide us? Data can… provide feedback on the past and provide a basis to begin planning for the future Department of Mathematics and Science
IMPORTANCE OF DATA • Facilitate a clear understanding of the gaps between where the school or class is and where it wants to be. • Show if school or class goals and objectives are being accomplished. • Predict and prevent failures. • Predict and ensure successes. • Establish foundation for Continuous School Improvement/SIP. • Data drives instruction, and professional development. Department of Mathematics and Science
Effective Use of Classroom Data Planning Teaching UsingResults Student Learning Assessing Source: Dr. Yuwadee Wongbundhit
DATA DISAGGREGATION • GRADE K-5 BASELINE AND PRETEST ASSESSMENT RESULTS (2014-2015) Department of Mathematics and Science
Elementary Science Pretest Performance by Reporting Category (2013-2014)
DATA DISAGGREGATION (Baseline 2013-14) Your thoughts….. • What reporting category do you think showed the highest performance? Why? • What reporting category do you think showed the lowest performance? Why? • How do you think the students performed on the Fair Game benchmarks? Do you think they performed better than last year? Department of Mathematics and Science
Assessments Department of Mathematics and Science • Interim Assessments (IA) for Grade 5 (All benchmarks will be assessed on Gr 5 Baseline, Fall and Winter assessments) • Quarterly Science Benchmark Assessments (QSBA) for Grades K- 4 will assess benchmarks covered in each quarter: Quarters 1, 2, 3, 4 • QSBA for K-4 will be administered at the end of each grading period. • QSBA Quarter 1 Admin window: Oct 27 – Nov 14, 2014 Available: First QSBA available October 22, 2014
Gr. 5 Science Interims Cut Scores • Grade 5 Science Interim cut scores are based on statistical regression analysis between students performance on Interim Assessment and scale scores on 2012 FCAT 2.0: • Fall IA satisfactory cut score: 51% or higher • Winter IA satisfactory cut score: 53% or higher • (Cut Scores) • Baseline Proficiency Level: 70% Department of Mathematics and Science
DATA DISAGGREGATION (FCAT 2014 Results) Your thoughts….. • What reporting category do you think showed the highest performance? Why? • What reporting category do you think showed the lowest performance? Why? • How did our performance compare to the State, Broward and West Palm Beach? Department of Mathematics and Science
Performance by Reporting Categories (Gr 5 Science FCAT) 2012-2014 (Retro)
Performance by achievement levels (Gr 5 Science FCAT 2012-14)
Grade 5 FCAT Science Comparative Results for MDCPS, State, Broward & Palm Beach (2012-2014)
Gr 5 Science FCAT 2.0 Scale Score L1 140 - 184 L2 185 - 199 L3 200 - 214 L4 215 – 224 L5 225 - 260 Source: Florida Department of Education
Data Online Resources -School Performance Data, FCAT, Baseline and Interims http://oada.dadeschools.net http://curriculum.dadeschools.net https://thinkgate.net/FLMiamiDade/