Download
1 / 22
220 likes | 359 Vues
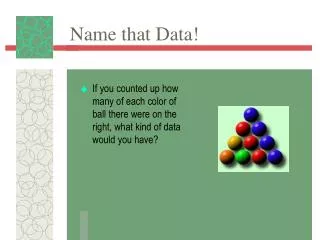
Descriptive Statistics - organize data so that we can communicate about that data. www.psychlotron.org.uk. Levels of Measurement. Nominal -frequency headcount ; things can only belong to one category ex the no of students wearing yellow shirts.

E N D
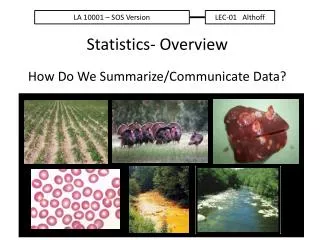
Descriptive Statistics- organize data so that we can communicate about that data. www.psychlotron.org.uk
Levels of Measurement • Nominal-frequency headcount; things can only belong to one category ex the no of students wearing yellow shirts. • Ordinal –data which is ranked or put in order. It is not known what the interval between each rank is ex 1st,2nd,3rd time in a swimming trial • Interval/ratio- measurement on a scale where the intervals are known and equal (ratio has a true zero point; interval can move into negs. Ex of ratio is time in secs.
Descriptive statistics provide for.. • Measure of central tendency • Gives a typical value for the data set • Tells you where the middle of the data set is • Measure of dispersion • Indicates how the data are spread out • Tells you what the rest of the data are
Descriptive Statistics • The aim of descriptive statistics is to give an accurate summary of the data • The wrong choice of statistic gives a distorted picture of the data • This can lead to the wrong conclusions being drawn from the data • Each measure of CT and D has its advantages and disadvantages www.psychlotron.org.uk
Measures of Central Tendency • The mean – total scores divided by the number of scores • Adv: it uses all the values in the set, so is most sensitive to variations in the data • Dis: it can be artificially raised or lowered by an extreme value, or by skewed data • Use it when the data are normally distributed, unskewed and there are no outliers www.psychlotron.org.uk
Measures of Central Tendency • The median – the middle score in a range What is the median 2,3,3,4,4,4,4,5,5,6,42? • Adv: it is based on the order of the data, not their actual values, so not distorted by extreme values • Dis: however, this makes it less sensitive to variations in the data • Use it when you can’t use the mean because of skew, outliers etc. www.psychlotron.org.uk
Measures of Central Tendency • The mode -most frequently occurring value • Adv: it’s the only measure suitable for summarising category/frequency data • Dis: for many data sets there is no modal value, or their may be several • Use when dealing with frequency data, and/or where there is a clear modal value in the set www.psychlotron.org.uk
Calculate…. • A psychologist has obtained the following scores. Answer the questions below. • 8 1 5 5 2 7 1 1 1 4 6 8 9 9 • The range of these scores is __________________________ • The mean of these scores is __________________________ • The mode of these scores is __________________________ • The median is ______________________________________
Measures of dispersion • Range-difference between the smallest and largest value Ex 3,4,7,7,8,9,12,4,17,17,18 =18-3 =16 • Although quick and easy to calculate it is distorted by extreme values
Standard deviation – a measure of the spread of scores around the mean • It is the most sensitive measure of dispersion using all available data. It can be used to relate the sample data to the population’s parameters.
SD formula • Sum of all participant scores divided by the no of participants = mean • Subtract the mean from each score • Square each of these scores • Total the squared scores • Divide by one less than the total participants. This is the variance • Take the square root of the variance.
Work out the SD…. • Scores – 13,6,10,15,10,15,5,9,10,13,6,11,7 • p201
Graphs • Bar chart –Shows data for categories that the researcher is interested in comparing
Histogram • Shows data for all categories even those with zero value
Frequency polygon/line graph • Shows two sets of data on one graph
Pie charts • Show the proportion of all scores gained by various categories
Inferential statistics- indicating how significant results are. • A significant result is one where there is a low probability that chance factors were responsible for observed difference • 5% level of significance, in psychology, is acceptable (P is less than 0.05) • There is less than a 5 % likelihood that the difference was due to chance.
Inferential tests • Provide a calculated value based on the results of the investigation • This value is then compared to a critical value (statistical tables) to determine if the results are significant • In chi square, sign test, spearman’s rho the calculated value must exceed the critical value.
Choosing an inferential test • Nominal data and independent measures design = chi square test • Ordinal data and independent measures design = Mann Whitney U • Interval and ratio data and independent measures design = Unrelated T-test • Nominal data and repeated measures design =Sign test • Ordinal data and repeated measures design = Wilcoxon test • Interval or ratio data and repeated measures design = related T-test
Groups select and practice your test Chi Square 162-168 Mann Whitney U test 170-172 / 182 Wilcoxon -168-170 Intro 143