Download
1 / 67
670 likes | 1.32k Vues
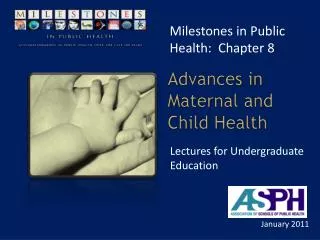
Milestones in Public Health: Chapter 8. Advances in Maternal and Child Health. Lectures for Graduate Public Health Education . January 2011. Learning Objectives. Describe the “continuum of care” concerns, linking maternal, newborn, and child health

E N D
Milestones in Public Health: Chapter 8 Advances in Maternal and Child Health Lectures for Graduate Public Health Education January 2011
Learning Objectives Describe the “continuum of care” concerns, linking maternal, newborn, and child health List interventions delivered at specific timeframes which result in multiple benefits Describe the significant disparities by race and ethnicity that persist today Discuss the association among family, poverty and children’s health Assess achievement of benchmark objectives for MCH in Healthy People 2010 thus far
Learning Objectives (Cont.) Analyze the Annual Survey of Vital Statistics for Children (2006) Discuss the historical foundations of maternal and child health Describe how federal, state, local health and educational agencies, legal entities and universities and community-based organizations can work together to improve health outcomes and leverage resources to implement successful and preventive interventions
Learning Objectives (Cont.) Define categories of pre-term birth and low birthweight babies Describe data on pre-term birth and its risks Explore determinants for escalating prematurity Discuss pre-term birth health disparities Analyze economic impact of pre-term and low birthweight babies
Lecture Outline Historical Perspective The Milestone & its Impact on Public Health Biology, Behavior and Science Systems, Policies & Programs Looking Ahead Conclusion References and Resources
Advances in Maternal and Child Health Historical Perspective
Historical Perspective Arias et. al. (2010) Remarkable advances in women’s health throughout the 20th century: • Average life-span increased by more than 30 years
Historical Perspective (Cont.) Century of Women’s Health (2002) Significant reduction in death, disease and disability due to: • Improvements in sanitation practices • Health care training • Public health information • Preventive health practices • Medical treatments • Implementation of national public health practices
Historical Perspective (Cont.) Century of Women’s Health (2002) • Significant reduction in death, disease and disability due to: • Expanded access to health care services through both development of public health care infrastructure and increased access to private, employer-based health insurance • Education and entry into male-dominated medical professions • Formalization of female-dominated health professions such as nursing and midwifery
HRSA-MCH Timeline, 2010 1800 1840 1860 1880 1900 1800: Smallpox vaccination begins in the U.S. 1840s: Public school movement 1850: First children’s hospital 1860: First children’s clinic 1874: Society for the prevention of cruelty to children established 1881: Abolition of child labor becomes top priority for AFL 1893: First milk stations 1907: First Bureau of Child Hygiene
HRSA-MCH Timeline, 2010 (Cont.) 1910 1920 1930 1940 1950 1960 1909: Prevention of infant mortality and prenatal care organized 1912: Children’s Bureau established 1914: Pamphlet on infant care published 1930: Prevention of rickets through milk fortification 1938: March of Dimes 1939: Food stamp program 1946: Hill-Burton Act, UNICEF and CDC established 1949: Apgar score developed 1954: Polio vaccine developed 1962: Child abuse formally recognized in the U.S.
HRSA-MCH Timeline, 2010 (Cont.) 1970 1980 1990 1970: Developmental Disabilities Service Act Passed 1972: Special Supplemental Food Program for WIC Created 1975: Education for All Handicapped Children Act Passed 1978: Smallpox Eradicated 1981: AIDS 1981: Title V of the Social Security Act Amended 1984: Child Safety Seats 1985: Preventing Low Birth Weight IOM Report Published 1990: NIH Office of Research on Women's Health Established 1994: Violence Against Women Act 1997: State Children's Health Insurance Program (SCHIP) Title XXI was added to Social Security Act
HRSA-MCH Timeline, 2010 (Cont.) 2000 2000: Oral Health in America: A Report of the Surgeon General Released 2000: New Regulations Added to the Health Insurance Portability and Accountability Act of 1996 (HIPAA) 2002: Childhood Obesity Tripled since 1980 2002: No Child Left Behind Act Signed into Law 2006: Increase in Autism Awareness and Funding 2007: WIC Food Package Revised 2009: Children's Health Insurance Program Reauthorization Act 2009: American Recovery and Reinvestment Act Passed
Advances in Maternal and Child Health The Milestone & Its Impact on Public Health
“The Challenge” CDC (1999) • What is the greatest public health achievement in the 20th century? • Sanitation? • Vaccinations? • Maternal and child health? • What do you think?
Then and Now • 1900 • for every 1,000 live births: • 6-9 women died of pregnancy-related complications • 100 infants died before age 1 year At the beginning of the 20th century in the U.S., maternal and infant mortality were fearsome. . . 2000 for every 1,000 live births: • 0.1 maternal deaths • 7.2 infants died before age 1 year
What Were the Main Reasons for This Amazing Achievement? • Improvements in medical care and public health interventions both played important roles: • Environmental interventions • Nutrition improvements • Advances in clinical medicine • Improvements in access to health care • Improvements in surveillance and monitoring of disease • Higher education levels • However, significant health disparities still exist
Milestone Overview: Five Snapshots March of Dimes (2008) On an average day in the U.S. Quick stats for the U.S. Maternal mortality Infant mortality Healthy People 2010
Maternal Mortality March of Dimes (2008) A maternal death is defined as one that occurs during pregnancy or within 42 days of the end of a pregnancy, irrespective of the duration and site of the pregnancy, from any cause related to or aggravated by a woman’s pregnancy or its management, but not from accidental or incidental causes
Infant Mortality March of Dimes (2008) Infant mortality refers to deaths under age one The infant mortality rate is the number of infant deaths per 1,000 live births
Healthy People 2010 www.healthypeople.gov A series of national health objectives, released by the U.S. Department of Health and Human Services, in January 2000 These objectives are being used as a benchmark for measuring progress in health promotion and disease prevention Broad goals of this initiative are to increase the quality and years of healthy life and eliminate racial and ethnic disparities in health status
Advances in Maternal and Child Health Biology, Behavior and Science
Preterm Births National Center for Health Statistics (2004) More than 500,000 babies were born prematurely (preterm) in 2004, facing a much higher risk of health problems and death than other newborns • Premature infants are more than 15 times as likely as those not born preterm to die in the first year of life • Premature babies who survive may suffer lifelong consequences, such as mental retardation, blindness, chronic lung disease, and cerebral palsy
Preterm Births: Definitions March of Dimes (2008) A preterm birth occurs before 37 completed weeks gestation A very preterm birth occurs before 32 completed weeks gestation A late preterm birth occurs between 34 and 36 completed weeks gestation
Preterm Births: Stats National Center for Health Statistics (2004) March of Dimes (2008) Nearly 82,000 babies were born very preterm in 2004 These babies were more than 75 times as likely as those not born preterm to die in the first year of life Late preterm infants comprised 71.2 percent of all preterm births in 2004 and account for the majority of the increase in preterm birth rates over the past two decades
Risk of Preterm Births March of Dimes (2008) • While specific causes of preterm births are largely unknown, certain factors are associated with increased risk: • Maternal age – higher preterm birth rates found among the youngest and oldest mothers (16% of births to teens under 18 and nearly 17% of births to women 40 and older in 2004) • Multiple births – nearly 60% of twins and about 93% of triplets and higher-order births were preterm in 2004
Risk of Preterm Births (Cont.) National Center for Health Statistics (2004) Women with certain uterine or cervical abnormalities Previous preterm delivery Infections Smoking Illicit drug use Extremes of maternal weight Stress
Low Birthweight March of Dimes (2008) A low birthweight baby weighs less than 5.5 pounds (2,500 grams) A very low birthweight baby weighs less than 3.5 pounds (1,500 grams)
Low Birthweight (Cont.) March of Dimes (2008) • Many infants born too soon are born too small • More than 43 percent of babies born preterm in 2004 were also born low birth weight, while more than 67 percent of low birthweight babies were preterm • About one in 12 infants is born low birthweight – a rate that has risen nearly 11 percent in the past decade (from 7.3 percent in 1994 to 8.1 percent in 2004 • More than 60,000 babies were born very low birthweight in 2004 – 1.5 percent of live births
Race/Ethnicity of Mother March of Dimes (2008) Prematurity/low birth weight is the leading cause of death for African-American infants In 2004, nearly 18 percent of infants born to non-Hispanic black mothers were preterm, compared with more than 11 percent of infants born to non-Hispanic white mothers Infants born to non-Hispanic black mothers were more than two times as likely as those born to non-Hispanic white mothers to be very preterm – 4.1 percent of births, compared with 1.6 percent Of infants born to Hispanics, 12 percent were preterm and the rate was highest for babies born to Puerto Rican mothers (14 percent)
Cost of Preterm and Low Birthweight Babies March of Dimes (2008) In 2005, the annual societal economic cost (medical, educational, and lost productivity) associated with preterm birth in the United States was at least $26.2 billion During that same year, the average first year medical costs, including both inpatient and outpatient care, were about 10 times greater for preterm ($32,325) than for term infants ($3,325) The average length of hospital stays in 2005 was nearly nine times as long for a preterm infant (13 days) compared with an infant born at term (1.5 days)
Cost of Preterm and Low Birthweight Babies (Cont.) March of Dimes (2008) • Four of the ten most expensive hospital stays, regardless of age, are related to infant care: infant respiratory distress syndrome, prematurity/low birthweight, cardiac/circulatory birth defects, and lack of oxygen in infants • Costs associated with prematurity and low birthweight are not limited to the hospital stay at birth • Low birthweight accounts for 10 percent of all health care costs for children • Prematurity may result in long-term physical and mental disabilities, which generate additional costs • Children born prematurely are at greater risk of lower cognitive test scores and behavioral problems, and are more likely to be enrolled in special education classes than children born full term
Advances in Maternal and Child Health Systems, Policies and Programs
Hutchins (2001) How the Federal Maternal and Child Health Program Advanced the Field of Maternal and Child Health
Act of 1912 (P.L. 62-116) Hutchins (2001) Congress established The Children’s Bureau to help states and local groups take appropriate action to improve the care of pregnant women and children • Defined responsibility to cover all the nation’s children • Investigated and reported on the status of children regarding common as well as special needs • Established evidence for the purpose of stimulating actions in support of children
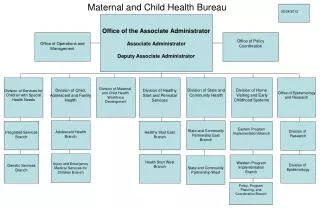
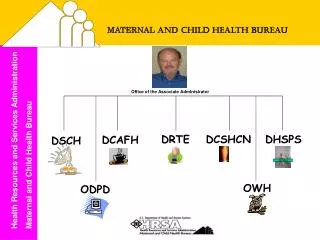
Maternal and Child Health Bureau (MCHB) Hutchins (2001) The mission of the Maternal and Child Health Bureau (MCHB) is to provide national leadership, in partnership with key stakeholders, to improve the physical and mental health, safety and well-being of the maternal and child health (MCH) population which includes all of the nation’s women, infants, children, adolescents, and their families, including fathers and children with special health care needs
Maternal and Child Health Bureau Goals (2007) Hutchins (2001) Goal 1: Provide National Leadership for Maternal and Child Health Goal 2: Promote an Environment that Supports Maternal and Child Health Goal 3: Eliminate Health Barriers and Disparities Goal 4: Improve the Health Infrastructure and Systems of Care Goal 5: Assure Quality of Care
MCH Program Leadership Hutchins (2001) Investigate and report Advocate Research and train Allocate funds Direct and redirect funds Assist as time and circumstance require
Health Insurance Topics Hutchins (2001) Access to care Coverage for women of childbearing age Coverage for children Medicaid’s role in maternal and child health State Children’s Health Insurance Program (S-CHIP) Medicaid and S-CHIP: Eligibility and enrollment
Access to Care:Having Insurance Affects Health Care Utilization Hutchins (2001) Uninsured women Receive fewer prenatal visits and have more trouble obtaining services In 1996, 18.1% reported NOT using medical services the year they gave birth (compared with 7.6% for private insurance and 8.1% for those with Medicaid) Uninsured Children Insurance status is the most important factor in determining accessibility to care Though uninsured newborns are more likely to be sick, they receive fewer hospital services Are most likely to have no usual source of medical care (28%, compared with 2.3% and 4.6% for private and public insurance)
Coverage for Women of Childbearing Age Hutchins (2001) One in five women of childbearing age is uninsured Hispanics in this group are three times as likely as whites to be uninsured Pregnant women are less likely to be uninsured (about 8% at delivery) In 2000, 7% of insurance plans offered by small employers did not cover prenatal care Individual health plans usually exclude, or add additional premiums, for prenatal care
Coverage for Children Hutchins (2001) In 2006, 12% of children under 19 in the U.S. did not have health insurance 61% of these children were from families with incomes below 200% of poverty and may have been eligible for public coverage Native American children are three times as likely as white children to be uninsured In 2004, 4.8% of infants born in hospitals were uninsured
Medicaid’s Role National Governors Association (2006) Centers for Medicare and Medicaid Services (2007a) Agency for Healthcare Research and Quality (2007) Medicaid is the major public source of financing for health services for pregnant women, infants, and children Medicaid financed 41% of hospital births in 2002 and covered nearly 30 million children in 2004 48% of hospital stays for preterm births were financed by Medicaid in 2004 (Approx $30,700 per birth) 46% of infant and child hospital stays due to birth defect were covered by Medicaid in 2006 Although women and children make up about 70% of Medicaid enrollees, they account for only 32% of spending