Download
1 / 18
180 likes | 299 Vues
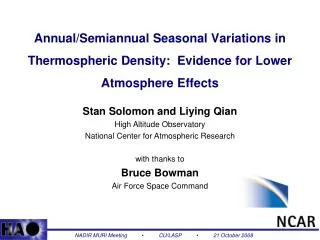
Effects of solar activity, co-rotating interaction regions, and climate change on thermospheric density during the solar cycle 23/24 minimum. Stan Solomon and Liying Qian High Altitude Observatory National Center for Atmospheric Research.

E N D
Effects of solar activity, co-rotatinginteraction regions, and climate changeon thermospheric densityduring the solar cycle 23/24 minimum Stan Solomon and Liying Qian High Altitude Observatory National Center for Atmospheric Research NADIR Meeting • Boulder, Colorado • 26 October 2011
Long-Term Satellite Drag Data Global average neutral density at 400 km, 81-day average and annual average (top), and superposed epoch analysis (bottom) Emmert et al., Geophys. Res. Lett., 37, L12102, 2010
Thermospheric Density and F10.7 at Solar Minimum -30% -4% Global average neutral density at 400 km, 81-day average and annual average (top), F10.7 Solar Activity Index (bottom) Emmert et al. (2010), Geophys. Res. Lett., 37, L12102
Thermospheric Response to Changes in CO2 Range of CO2 values during past 40 years
Solar EUV Measurements from SOHO Solar EUV Monitor • The Solar EUV Monitor (SEM) on the SOHO spacecraft indicates 15% less irradiance in 2008 than in 1996 in the 26-34 nm wavelength band. Quoted uncertainty is 6%. Didkovsky et al., SOHO-23 Workshop Proceedings, 2010 • LASP rocket and TIMED SEE results are consistent with the SEM measurements Uncertainty of ~20%
First Attempt to Model Thermospheric Density • Solomon et al. (2010), Geophys. Res. Lett., 37, L16103, doi:10.1029/2010GL044468. • Preliminary modeling work found reasonable agreement between solar EUV and density measurements. However, questions remain: • — Possible degradation of solar measurement? • — Role of global thermospheric cooling due to increasing CO2 levels? • — Role of low geomagnetic activity? Global annual average neutral density at 400 km plotted against annual average Solar EUV 26-34 nm from SOHO/SEM for the ascending (red) and descending (blue) phases of SC 23
Comparison of F10.7 Index to Mg II Core-to-Wing Ratio MgII data analysis courtesy of Rodney Viereck, NOAA/SWPC
Solar EUV Calculations using the Mg II Core-to-Wing Ratio EUV 10% lower using MgII c/w
Second Attempt to Model Thermospheric Density Solomon et al. (2011), J. Geophys Res., 116, in press, doi:10.1029/2011JA016508. NCAR Thermosphere-Ionosphere-Electrodynamics General Circulation Model Temperature and Density simulations at 400 km 2008 simulation includes combined effects of solar EUV decrease, CO2 increase, and geomagnetic activity changes
Model Calculations of Altitude Profiles Measured Density Change [Emmert et al., 2010]
Summary of Model Results Annual average global mean density at 400 km Using MgII c/w to calculate solar EUV and FUV Percentage differences from 1996 to 2008
What about the Ionosphere? TIE-GCM simulations using MgII predict 14% average reduction of NmF2
Do Ionospheric Observations Find This Modeled Decrease? Heelis et al., 2009: CINDI measurements indicate that ionosphere is lower and cooler than IRI empirical model during summer 2008. Lühr and Xiong, 2010: CHAMP and GRACE measurements indicate lower ionospheric densities than IRI and other models. Coley et al., 2010: Extended the analysis of Heelis et al. Chen et al., 2011: Long-term ionosonde data set shows lower NmF2 levels during 2008-2009 than previous solar minima. Liu et al., 2011: Extended the analysis of Chen et al. Araujo-Pradere et al., 2011: Analyzed ionosonde and total electron content (TEC) measurements, finding mixed results, depending on location, time of year, and especially time of day. BUT... Global average total electron content data sets derived from multi-point GPS measurements do not show this decline...
Conclusions • The thermosphere/ionosphere system was cooler, less dense, and lower, during the minimum of solar cycle 23/24 than during a “typical” solar minimum. • The primary cause of this was lower than “usual” solar EUV irradiance. • The Mg II core-to-wing ratio variations are consistent with these observations. • Secular change due to increasing CO2 makes a small but significant contribution. • Lower geomagnetic activity during 2008-2009 also makes a small but significant contribution. • Solomon, S. C., L. Qian, L. V. Didkovsky, R. A. Viereck, and T. N. Woods (2011), Causes of low thermospheric density during the 2007–2009 solar minimum, J. Geophys. Res., 116, A00H07, doi:10.1029/2011JA016508. • Work in progress extends this modeling effort to possible ionospheric changes.