Download
1 / 1
10 likes | 127 Vues
Magneto-elastic distortions in Single Crystal MgV 2 O 4. Mary Bauman, Florida State University Undergraduate Student.

E N D
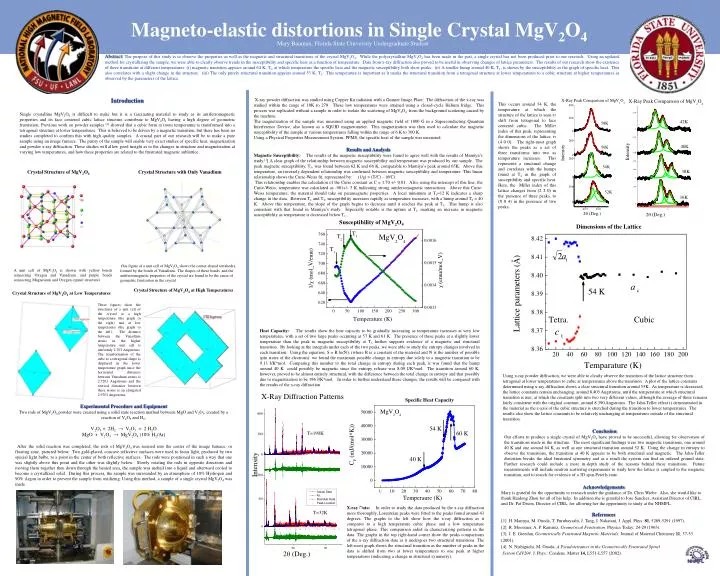
Magneto-elastic distortions in Single Crystal MgV2O4 Mary Bauman, Florida State University Undergraduate Student Abstract: The purpose of this study is to observe the properties as well as the magnetic and structural transitions of the crystal MgV2O4. While the polycrystalline MgV2O4 has been made in the past, a single crystal has not been produced prior to our research. Using an updated method for crystallizing the sample, we were able to clearly observe trends in the susceptibility and specific heat as a function of temperature. Data from x-ray diffraction also proved to be useful in observing changes of lattice parameters. The results of our research show the existence of three transitions at different temperatures: (i) magnetic transition appears around 64 K, T3, at which temperature the specific heat and the magnetic susceptibility both show peaks. (ii) A smaller hump around 40 K, T1, is shown by the susceptibility as the graph of specific heat. This also correlates with a slight change in the structure. (iii) The only purely structural transition appears around 53 K, T2. This temperature is important as it marks the structural transition from a tetragonal structure at lower temperatures to a cubic structure at higher temperatures as observed by the parameters of the lattice. Introduction Single crystalline MgV2O4 is difficult to make but it is a fascinating material to study as its antiferromagnetic properties and its face centered cubic lattice structure contribute to MgV2O4 having a high degree of geometric frustration. Previous work on powder samples [1] showed that a cubic form at room temperature is transformed into a tetragonal structure at lower temperatures. This is believed to be driven by a magnetic transition, but there has been no studies completed to confirm this with high quality samples. A crucial part of our research will be to make a pure sample using an image furnace. The purity of the sample will enable very exact studies of specific heat, magnetization and powder x-ray diffraction. These studies will allow good insight as to the changes in structure and magnetization at varying low temperatures, and how these properties are related to the frustrated magnetic sublattice. X-ray powder diffraction was studied using Copper Kα radiation with a Guinier Image Plate. The diffraction of the x-ray was studied within the range of 10K to 270. These low temperatures were attained using a closed-cycle Helium fridge. This process was replicated without a sample in order to isolate the scattering of MgV2O4 from the background scattering caused by the machine. The magnetization of the sample was measured using an applied magnetic field of 1000 G in a Superconducting Quantum Interference Device, also known as a SQUID magnetometer. This magnetization was then used to calculate the magnetic susceptibility of the sample at various temperatures falling within the range of 6 K to 300 K. Using a Physical Properties Measurement System, PPMS, the specific heat of the sample was measured. This occurs around 54 K, the temperature at which the structure of the lattice is seen to shift from tetragonal to face centered cubic. The Miller index of this peak, representing the dimensions of the lattice, is (4 0 0). The right-most graph shows the peaks as a set of three transforms into two as temperature increases. This represents a structural change and correlates with the humps found at T2 in the graph of susceptibility and specific heat. Here, the Miller index of this lattice changes from (2 2 0) in the presence of three peaks, to (0 0 4) in the presence of two peaks. Results and Analysis Magnetic Susceptibility: The results of the magnetic susceptibility were found to agree well with the results of Mamiya’s study.[1] A clear graph of the relationship between magnetic susceptibility and temperature was produced by our sample. The peak magnetic susceptibility, T3, was found between 62 K and 66 K, comparable to Mamiya’s peak around 65K. Above this temperature, an inversely dependent relationship was confirmed between magnetic susceptibility and temperature. This linear relationship shows the Curie-Weiss fit, represented by: (1/χ) = (T/C) – (θ/C) This relationship enables the calculation of the Curie constant as C = 1.70 +/- 0.01. Also, using the intercept of this line, the Curie-Weiss, temperature was calculated as -981+/- 5 K indicating strong antiferromagnetic interactions. Above this Curie-Weiss temperature, the material should take on paramagnetic properties. A local minimum at T1=12 K indicates a sharp change in the data. Between T1 and T3, susceptibility increases rapidly as temperature increases, with a hump around T2 = 40 K. Above this temperature, the slope of the graph begins to decrease until it reaches the peak at T3. This hump is also consistent with that found in Mamiya’s study. Especially notable is the upturn at T1, marking an increase in magnetic susceptibility as temperature is decreased below T1. Crystal Structure of MgV2O4 Crystal Structure with Only Vanadium Susceptibility of MgV2O4 Dimensions of the Lattice This figure of a unit cell of MgV2O4 shows the corner-shared tetrahedra formed by the bonds of Vanadium. The shapes of these bonds and the antiferromagnetic properties of the crystal are found to be the cause of geometric frustration in the crystal. A unit cell of MgV2O4 is shown with yellow bonds connecting Oxygen and Vanadium, and purple bonds connecting Magnesium and Oxygen (spinel structure). Crystal Structure of MgV2O4 at High Temperatures Crystal Structure of MgV2O4 at Low Temperatures These figures show the structures of a unit cell of the crystal at a high temperature (the graph to the right) and at low temperature (the graph to the left). The distance between the Vanadium atoms in the higher temperature unit cell is uniformly 2.763 Angstroms. The transformation of the cube to a tetragonal shape is displayed in the lower temperature graph since the horizontal distances between Vanadium atoms is 2.7203 Angstroms and the vertical distances between these atoms is an elongated 2.9703 Angstroms. Heat Capacity: The results show the heat capacity to be gradually increasing as temperature increases at very low temperatures, with a set of two large peaks occurring at 57 K and 61 K. The presence of these peaks at a slightly lower temperature than the peak in magnetic susceptibility at T3 further supports evidence of a magnetic and structural transition. By looking at the integrals under each of the two peaks, we were able to study the entropy changes involved in each transition. Using the equation, S = R ln(N), (where R is a constant of the material and N is the number of possible spin states of the electrons) we found the maximum possible change in entropy due solely to a magnetic transition to be 9.13 J/K*mol. Comparing this number to the total change in entropy during each peak, it was found that the hump around 40 K could possibly be magnetic since the entropy release was 8.09 J/K*mol. The transition around 60 K, however, proved to be almost entirely structural, with the difference between the total change in entropy and that possibly due to magnetization to be 196 J/K*mol. In order to further understand these changes, the results will be compared with the results of the x-ray diffraction. Using x-ray powder diffraction, we were able to clearly observe the transition of the lattice structure from tetragonal at lower temperatures to cubic at temperatures above the transition. A plot of the lattice constants determined using x-ray diffraction shows a clear structural transition around 53K. As temperature is decreased, the lattice constants remain unchanging, around 8.403 Angstroms, until the temperature at which structural transition is met, at which the constants split into two very different values, although the average of these remains fairly consistent with the original constant, around 8.390 Angstroms. The Jahn-Teller effect is demonstrated in the material as the z-axis of the cubic structure is stretched during the transition to lower temperatures. The results also show the lattice constants to be relatively unchanging at temperatures outside of the structural transition. Specific Heat Capacity Experimental Procedure and Equipment Two rods of MgV2O4 powder were created using a solid state reaction method between MgO and V2O3, created by a reaction of V2O5 and H2. V2O5 + 2H2→ V2O3 + 2 H2O MgO + V2O3→ MgV2O4 (10% H2/Ar) After the solid reaction was completed, the rods of MgV2O4 was secured into the center of the image furnace, or floating zone, pictured below. Two gold-plated, concave reflective surfaces were used to focus light, produced by two special light bulbs, to a point in the center of both reflective surfaces. The rods were positioned in such a way that one was slightly above this point and the other was slightly below. Slowly rotating the rods in opposite directions and moving them together then down through the heated area, the sample was melted into a liquid and afterward cooled to become a crystallized solid. During this process, the sample was surrounded by an atmosphere of 10% Hydrogen and 90% Argon in order to prevent the sample from oxidizing. Using this method, a sample of a single crystal MgV2O4 was made. Conclusion Our efforts to produce a single crystal of MgV2O4 have proved to be successful, allowing for observation of the transitions made in the structure. The most significant findings were two magnetic transitions, one around 40 K and one around 64 K, as well as one structural transition around 52 K. Using the change in entropy to observe the transitions, the transition at 40 K appears to be both structural and magnetic. The Jahn-Teller distortion breaks the ideal frustrated symmetry and as a result the system can find an ordered ground state. Further research could include a more in-depth study of the reasons behind these transitions. Future measurements will include neutron scattering experiments to study how the lattice is coupled to the magnetic transition, and to search for evidence of a 3D spin-Peierls state. Acknowledgements Mary is grateful for the opportunity to research under the guidance of Dr. Chris Wiebe. Also, she would like to thank Haidong Zhou for all of his help. In addition she is grateful to Jose Sanchez, Assistant Director of CIRL, and Dr. Pat Dixon, Director of CIRL, for allowing her the opportunity to study at the NHMFL. References [1] H. Mamiya, M. Onoda, T. Furubayashi, J. Tang, I. Nakatani, J. Appl. Phys.:81, 5289-5291 (1997). [2] R. Moessner, A. P. Ramirez, Geometrical Frustration. Physics Today: 24-29 (1963). [3] J. E. Greedan, Geometrically Frustrated Magnetic Materials. Journal of Material Chemistry 11, 37-53 (2001). [4] N. Nishiguchi, M. Onoda, A Pseudotetramer in the Geometrically Frustrated Spinel System CdV204. J. Phys.: Condens. Matter 14, L551-L557 (2002). X-ray Data: In order to study the data produced by the x-ray diffraction more thoroughly, Lorentzian peaks were fitted to the peaks found around 43 degrees. The graphs to the left show how the x-ray diffraction as it compares to a high temperature cubic phase and a low temperature tetragonal phase. This comparison aided in characterizing patterns in the data. The graphs in the top right-hand corner show the peaks comparisons of the x-ray diffraction data as it undergoes two structural transitions. The left-most graph shows the structural transition as the number of peaks in the data is shifted from two at lower temperatures to one peak at higher temperatures (indicating a change in structural symmetry).