Download
1 / 19
190 likes | 359 Vues
Global Estimates of Gravity Wave Parameters in the UTLS from GPS Temperature Retrievals. Ling Wang and M. Joan Alexander NorthWest Research Associates, CoRA Div. Overview of Talk. Introduction COSMIC and CHAMP GPS temperature data

E N D
Global Estimates of Gravity Wave Parameters in the UTLS from GPS Temperature Retrievals Ling Wang and M. Joan Alexander NorthWest Research Associates, CoRA Div.
Overview of Talk • Introduction • COSMIC and CHAMP GPS temperature data • New method to derive gravity wave parameters and some preliminary results • Uncertainties of the new GW analysis • Summary 2/19
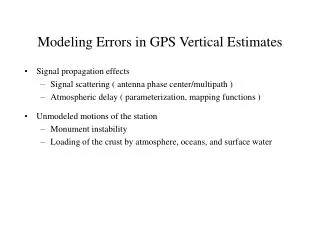
Introduction (1) • GWs play significant roles in the dynamics and transport and mixing processes in the UTLS and they can also affect the formation of cirrus clouds. • At present, observational constraints on GW parameters including momentum flux & propagation direction are sorely needed to improve the modeling of GW effects on various processes and phenomena in the UTLS (and elsewhere). 3/19
Introduction (2) • Hodograph analysis and Stokes parameters method (e.g., Eckermann and Vincent, 1989, Pure Appl. Geophys) have been used to derive GW propagation direction and other wave parameters. • These methods require, however, both temperature & wind information, which is NOT available for most satellite data. 4/19
Introduction (3) • Ern et al. (2004, JGR) use phase differences between adjacent T profiles to get global estimates of GW horizontal wavelength and momentum flux from the CRISTA satellite data. Horizontal wavelength and momentum flux at 25 km altitude in August 2007 (Ern et al., 2004). 5/19
Introduction (4) Alexander et al. (2008, JGR) use a similar approach to derive GW horizontal structures from the HIRDLS satellite data. Momentum flux and horizontal wavenumber between 20-30 km altitude in May 2006 (Alexander et al., 2008). 6/19
Introduction (5) • In most GW analyses of satellite data so far, GW propagation directions are not routinely derived. • This study introduces a new method to estimate the complete set of GW parameters (including horizontal propagation direction) from the GPS RO temperature data alone. 7/19
Data (1) • COSMIC (Constellation Observing System for Meteorology Ionosphere and Climate/Formosa Satellite 3) GPS RO data • CHAMP (Challenging Minisatellite Payload) GPS RO data (from Anthes et al., 2008, BAMS) • GPS RO technique: phase delay of GPS signals --> bending angle of radio wave --> atmospheric refractivity --> temperature profiles 8/19
Data (2) • Unlike most other satellite data, GPS data do not have regular orbits. • COSMIC: 2006-present; ~ 1500 daily profiles • CHAMP: 2001-2008; ~ 150 daily profiles • We use dry T profiles processed by UCAR CDAAC. • Vertical resolution: ~ 1 km • Accuracy: sub-Kelvin • Temperature data cover troposphere and stratosphere. Map showing a typical daily COSMIC/CHAMP data coverage. 9/19
Gravity Wave Analysis (1) GW Temperature Perturbation Since large-scale wave motions (e.g., Kelvin waves) can have similar vertical wavelength as GWs, we extract GW perturbations by removing zonal modes 0-6. One example of GPS temperature, background T determined from our procedure and the resulting GW temperature perturbation profile. 10/19
Gravity Wave Analysis (2) T Amplitude & Vertical Wavelength • We derive the dominant GW T amp & vertical wavelength at each height from wavelet analysis. • GW amplitudes generally decrease with increasing latitudes. • Vertical wavelengths also display strong latitudinal variability. Dominant T amp & vertical wavelength averaged between 17.5-22.5 km during December 2006-February 2007. 11/19
Gravity Wave Analysis (3) Horizontal Wave Vector If we neglect time variation, at the same z & for the same vertical wavelength, phase differences among adjacent soundings are related with horizontal wave vector (k, l) and distances among the soundings as follows: We can determine phase differences from cross-wavelet analysis. If there are at least 3 soundings in one space-time cell (e.g., 15 deg by 15 deg by 6 hours), we can solve for an over-determined linear problem for (k, l) using LSF. n soundings --> [n!/(n-2)!/2] equations, e.g., 4 soundings --> 6 equations to solve for (k, l) 12/19
Gravity Wave Analysis (4) Horizontal Wavelength We use (15 deg X 15 deg X 6 hours) cells across the globe. GWs are generally longer at lower latitudes, being consistent with many previous studies. averaged between 17.5-22.5 km during December 2006-February 2007 13/19
Gravity Wave Analysis (5) <-- GW dispersion relation Most of the waves captured in our analysis are low intrinsic frequency inertia-GWs. The latitudinal variation of intrinsic frequency is consistent with radiosonde analysis (Wang, Geller, and Alexander, 2005, JAS). averaged between 17.5-22.5 km during December 2006-February 2007 14/19
Gravity Wave Analysis (6) With T’, k, l, m, & intrinsic frequency derived, the momentum flux components are evaluated using the left formula. The magnitudes of MF are reasonable comparing with previous studies. The effects of both convection and topography on GW excitations are clearly seen. averaged between 17.5-22.5 km during December 2006-February 2007 15/19
Gravity Wave Analysis (7) We compare GPS results with radiosonde analysis using the Stokes parameters method. GWs generally propagate eastward in the tropics and westward in mid- and high-latitudes, being opposite to the prevailing background winds. The two analyses are not dealing with exactly the same part of GW spectrum due to the details of the two analyses. 18-24.9 km, December 2006-February 2007 16/19
Gravity Wave Analysis (8) Topography is one of the major GW sources and mountain waves are expected to propagate upwind and orthogonal to the orientation of topography. Results largely consistent with what is expected from the orientation of the southern Andes and the prevailing westerlies 17.5-22.5 km, June-August 2007 17/19
Uncertainties of Analysis • We assume the existence of a single & dominant GW mode in each (lon, lat, time) cell at each height - Can reduce uncertainties by reducing the size of each cell and setting amplitude thresholds for dominant modes - & by including treatment for secondary modes (if there are any) • We neglect time variation of GW modes - Can solve this by using the following complete formula to solve for k, l, &ground-based frequency simultaneously (which puts additional requirement for data coverage though): 18/19
Summary • We introduce a new method based on the cross-wavelet analysis to estimate the complete set of GW parameters from the GPS RO temperature data. • We present some preliminary results in the UTLS which demonstrate the effectiveness of the new method. • The uncertainties of this new GW analysis and possible ways to deal with them are discussed. 19/19