Download
1 / 7
80 likes | 186 Vues
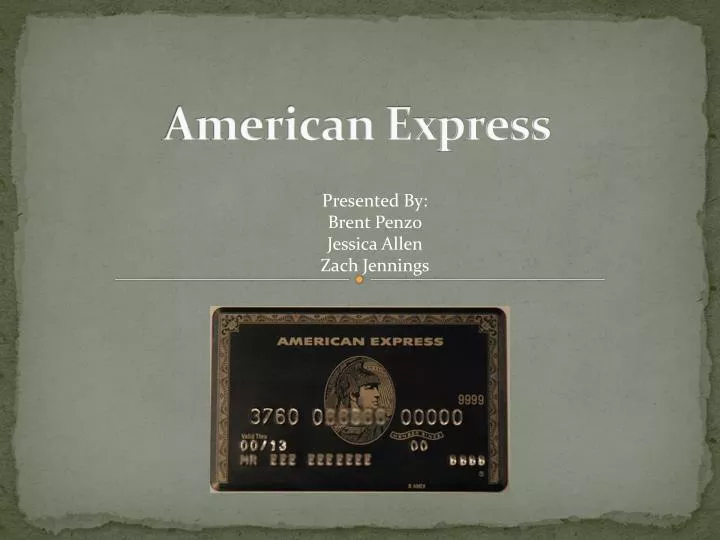
American Express. Presented By: Brent Penzo Jessica Allen Zach Jennings. Technical Analysis of AXP stock. Support & Resistance Level. Support Level = $44.18 Resistance Level was broken on April 26 th , 2010 with a stock price of $48.05.

E N D
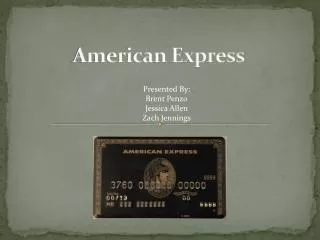
American Express Presented By: Brent Penzo Jessica Allen Zach Jennings
Support & Resistance Level • Support Level = $44.18 • Resistance Level was broken on April 26th, 2010 with a stock price of $48.05. • This indicates that the stock price will continue in this upward direction.
Closing Arms (TRIN) • Declining Volume = 404,934,080 • Declining Issues = 1,242 • 404,934,080/1,242 = 326,033.8808 • Advancing Volume = 1,034,875,113 • Advancing Issues = 1,849 • 1,034,875,113/1,849 = 559,694.4905 • Closing Arms = .5825211545 • Arms < 1 Meaning the market is bullish.
Price Channel The Price Channel shows a continuation pattern sloping upwards which signals a favorable stock to invest in.
50 & 200 Day Moving Average Both 50 and 200 day Moving Average are increasing which indicates favorable short term and long term out looks.
American Express GOOD