Download
1 / 24
330 likes | 705 Vues
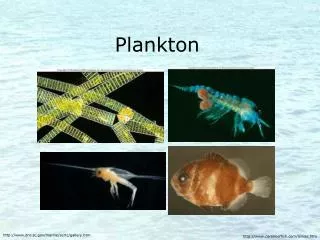
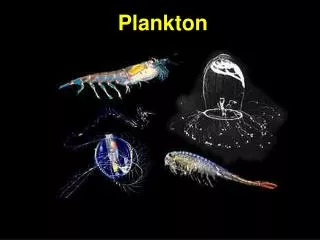
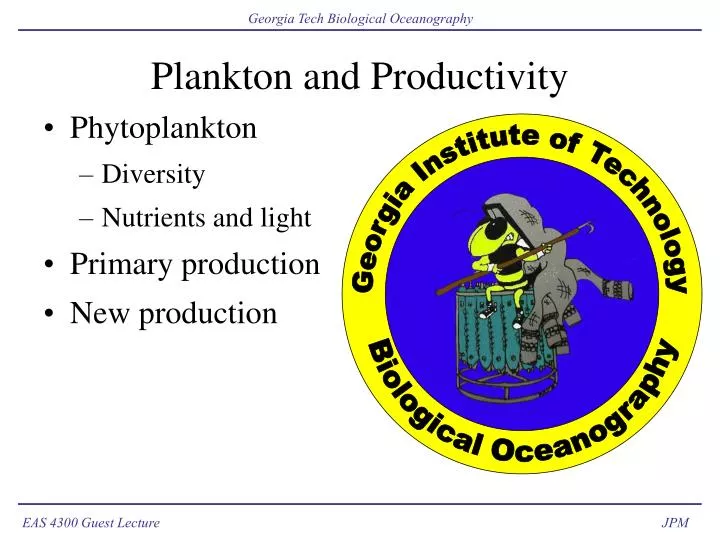
Georgia Institute of Technology. Biological Oceanography. Plankton and Productivity. Phytoplankton Diversity Nutrients and light Primary production New production. Fig. 1. Examples of representative marine eukaryotic phytoplankton.

E N D
Georgia Institute of Technology Biological Oceanography Plankton and Productivity • Phytoplankton • Diversity • Nutrients and light • Primary production • New production
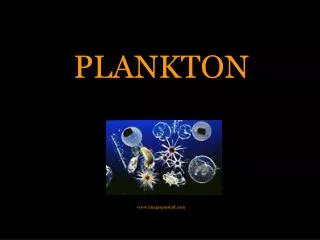
Fig. 1. Examples of representative marine eukaryotic phytoplankton P. G. Falkowski et al., Science 305, 354 -360 (2004) Published by AAAS
Tricho&Picos Trichodesmium tufts N2-fixing cyanobacteria (Synechocystis) from Station ALOHA (10 µm scale bar)
Diatom Diversity (4) Top left: Chaetoceros debilis: spiny chain diatom Bottom left: Ditylum brightwelli Top right: Coscinodiscusgranii NB: Much of the internal volume of the cell is filled by a vacuole. Strands of cytoplasm can be seen running through the vacuole. Images from the Microscopy-UK Library: http://www.microscopy-uk.net/micropolitan/index.html
Emiliana huxleyi coccoliths From the E. huxleyi site: http://www.soes.soton.ac.uk/staff/tt/eh//coccoliths.html
Emiliana huxleyi World From the E. huxleyi site: http://www.soes.soton.ac.uk/staff/tt/eh/
Dinoflagellate Diversity (1) Dinophysis & Ceratium http://www.whoi.edu/science/B/redtide/rtphotos/rtphotos.html
Dinoflagellate Diversity (3) Citharistes sp. Arrow points to chamber containing cyanobacteria. Ornithocercus magnificus. Arrow points to girdle list, which contains cyanobacteria. Inset shows epifluorescence image with cyanobacteria fluorescing orange-yellow. Images from Carpenter 2002 Proc. Roy. Irish Acad. 120B: 15-18.
Phytoplankton Growth • Specific growth rate N(t) = Noeµt • N = biomass (cell number, PN, PC, etc.) • µ = specific growth rate (t-1) • Note that µ really reflects the net growth rate N(t) = Noe(p-r)t • p = specific production rate (t-1) • R = specific respiration rate (t-1)
Marine N Limitation (Ryther & Dunstan 1971) Krebs, Fig. 25.08
“Biolimiting” Behavior – NO3- Data: eWOCE Line A16. Figure prepared with ODV
North Atlantic Nutrient Ratios Data: eWOCE. Plot prepared with ODV
Redfield Ratio • The major nutrients occur in roughly constant ratios in deep water and in plankton. • Nutrients are removed from warm surface waters by plankton and released at depth by biological remineralization of organic matter. • The average ratio of nutrients is called the Redfield ratio after A.C. Redfield. • Biological activity drives the ocean to this state!
Nutrient Limitation: N vs. P • The N:P ratio of plankton is the same as the N:P ratio of the deep ocean (Redfield ratio). • Since N & P therefore enter the upper ocean in the same proportions as they’re required by phytoplankton, why does N appear to be limiting? • Food webs preferentially export N from the upper ocean.
Light in the Water Column • The deeper you go, the darker it gets… I(z) = Ioe-kz Mann & Lazier Fig. 3.05b (left), Miller Fig. 3.3 (right)
P/I Relationship Lalli Parsons Fig. 3.5
Stratification and Production • Size of circles reflects intensity of mixing. Note inhibition of mixing by the pycnocline (A & C). • Light decreases exponentially and determines where phytoplankton become light-limited. • Below the euphotic depth, phytoplankton die. Mann&Lazier Fig.3.05
Production vs. Depth • Gulf of Alaska data for May (closed circles) and September (open circles) Miller, Fig. 3.9
Patterns in Primary Production • Above: Typical annual cycles of primary production. Solid lines show phytoplankton biomass, blue lines show zooplankton biomass. • Left: Schematic of relative abundance of light and nutrients at the sea surface as a function of latitude. Lines show relative seasonal change in primary production at three latitudes. Lalli & Parsons, Figs. 3.9 & 3.17
Riley-Sverdrup Bloom Model • Assumptions • Biomass uniformly distributed • P scales with I • R is constant • Compensation depth (Dc) • P = R for individual phytoplankton. • Critical depth (Dcr) • Community between surface and Dcr in balance. • Blooms occur when Dcr > Dmix. Miller, Fig. 1.3
Biological Pump NH4+ New vs. Regenerated Production modified from http://www.up.ethz.ch/research/nitrogen_cycle/index
Measurement of Primary Production • ∆Biomass • Practical difficulties in separating phytoplankton from other components of the ecosystem. • Oxygen light-dark bottle method • The dark bottle measures community respiration. • The light bottle measures net community photosynthesis. • 14C Incorporation • The dark bottle provides ambiguous information. • The light bottle measures something near net production. • Long incubations may lead to recycling and equilibration. • Bottle effects may compromise all these approaches!
Distribution of Primary Production • Open ocean production dominates the budget despite the low areal rates. • Bottle effects may lead to underestimates in all environments, but especially in the open ocean.
Chl Distribution: Atlantic Composites: Sep 97 - Aug 98